- Period
- 2024–2025
- Location
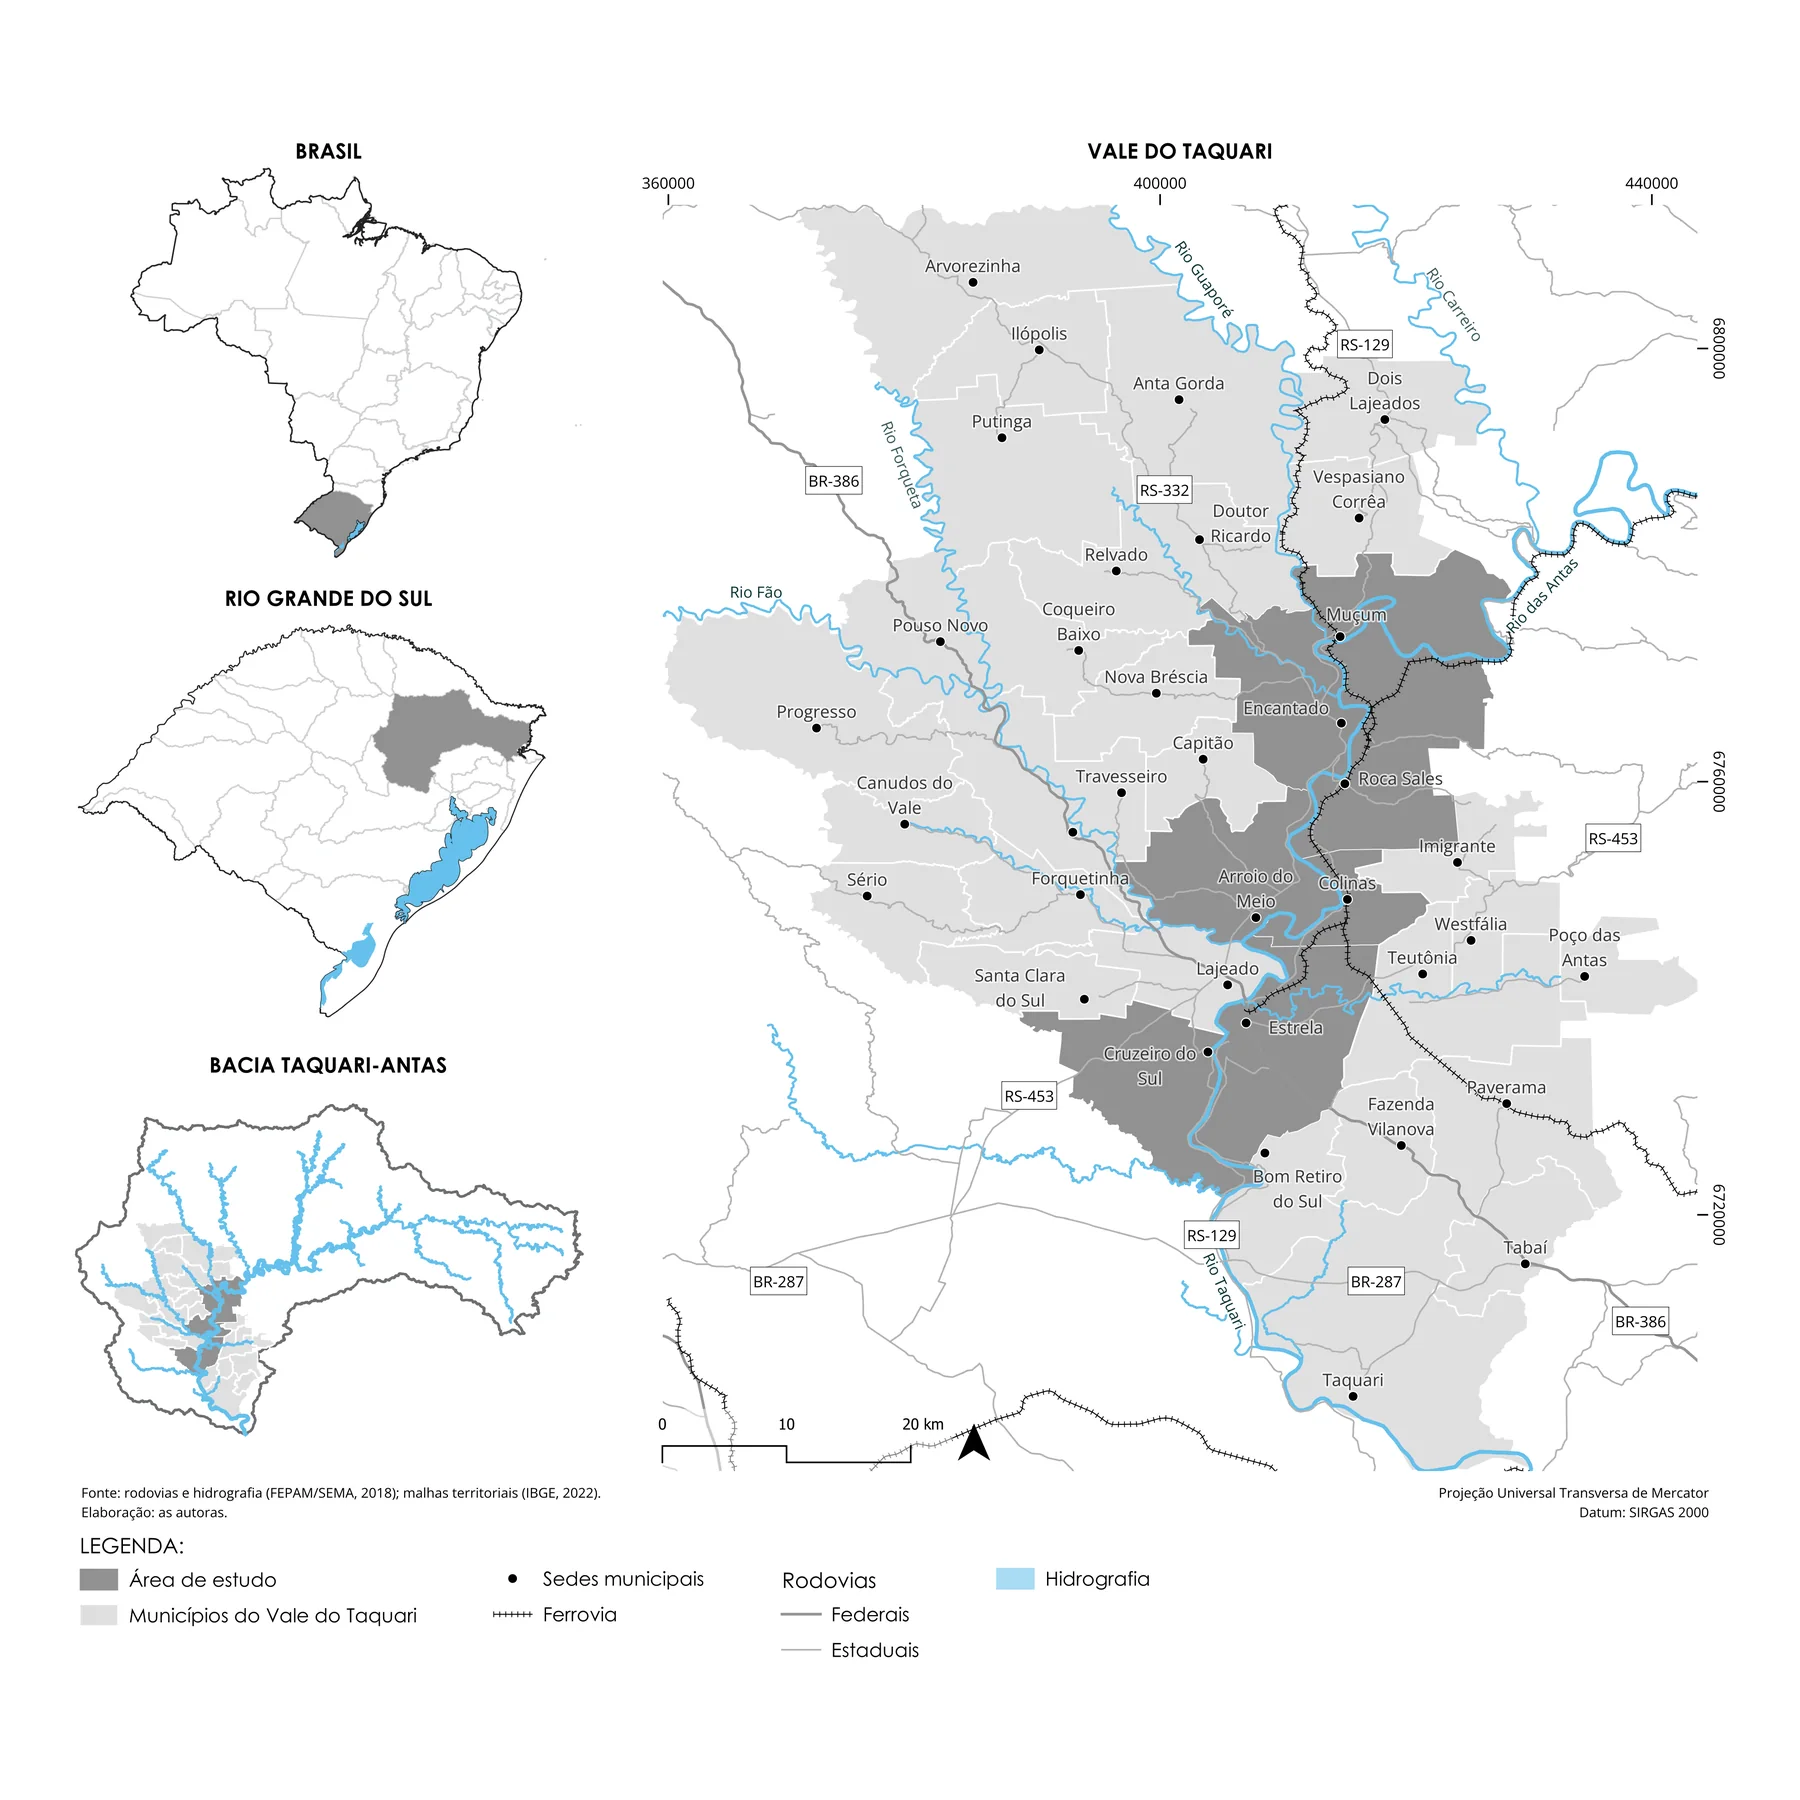
- Taquari Valley, Rio Grande do Sul, Brazil: Arroio do Meio, Colinas, Cruzeiro do Sul, Encantado, Estrela, Muçum and Roca Sales
- Partners
- SEDUR/RS (State Secretariat of Urban and Metropolitan Development), Univates, municipal governments
- My role
- Geospatial analyst on the georeferencing team: spatial data processing, multicriteria suitability modeling and map production for the municipal reports.
- Data
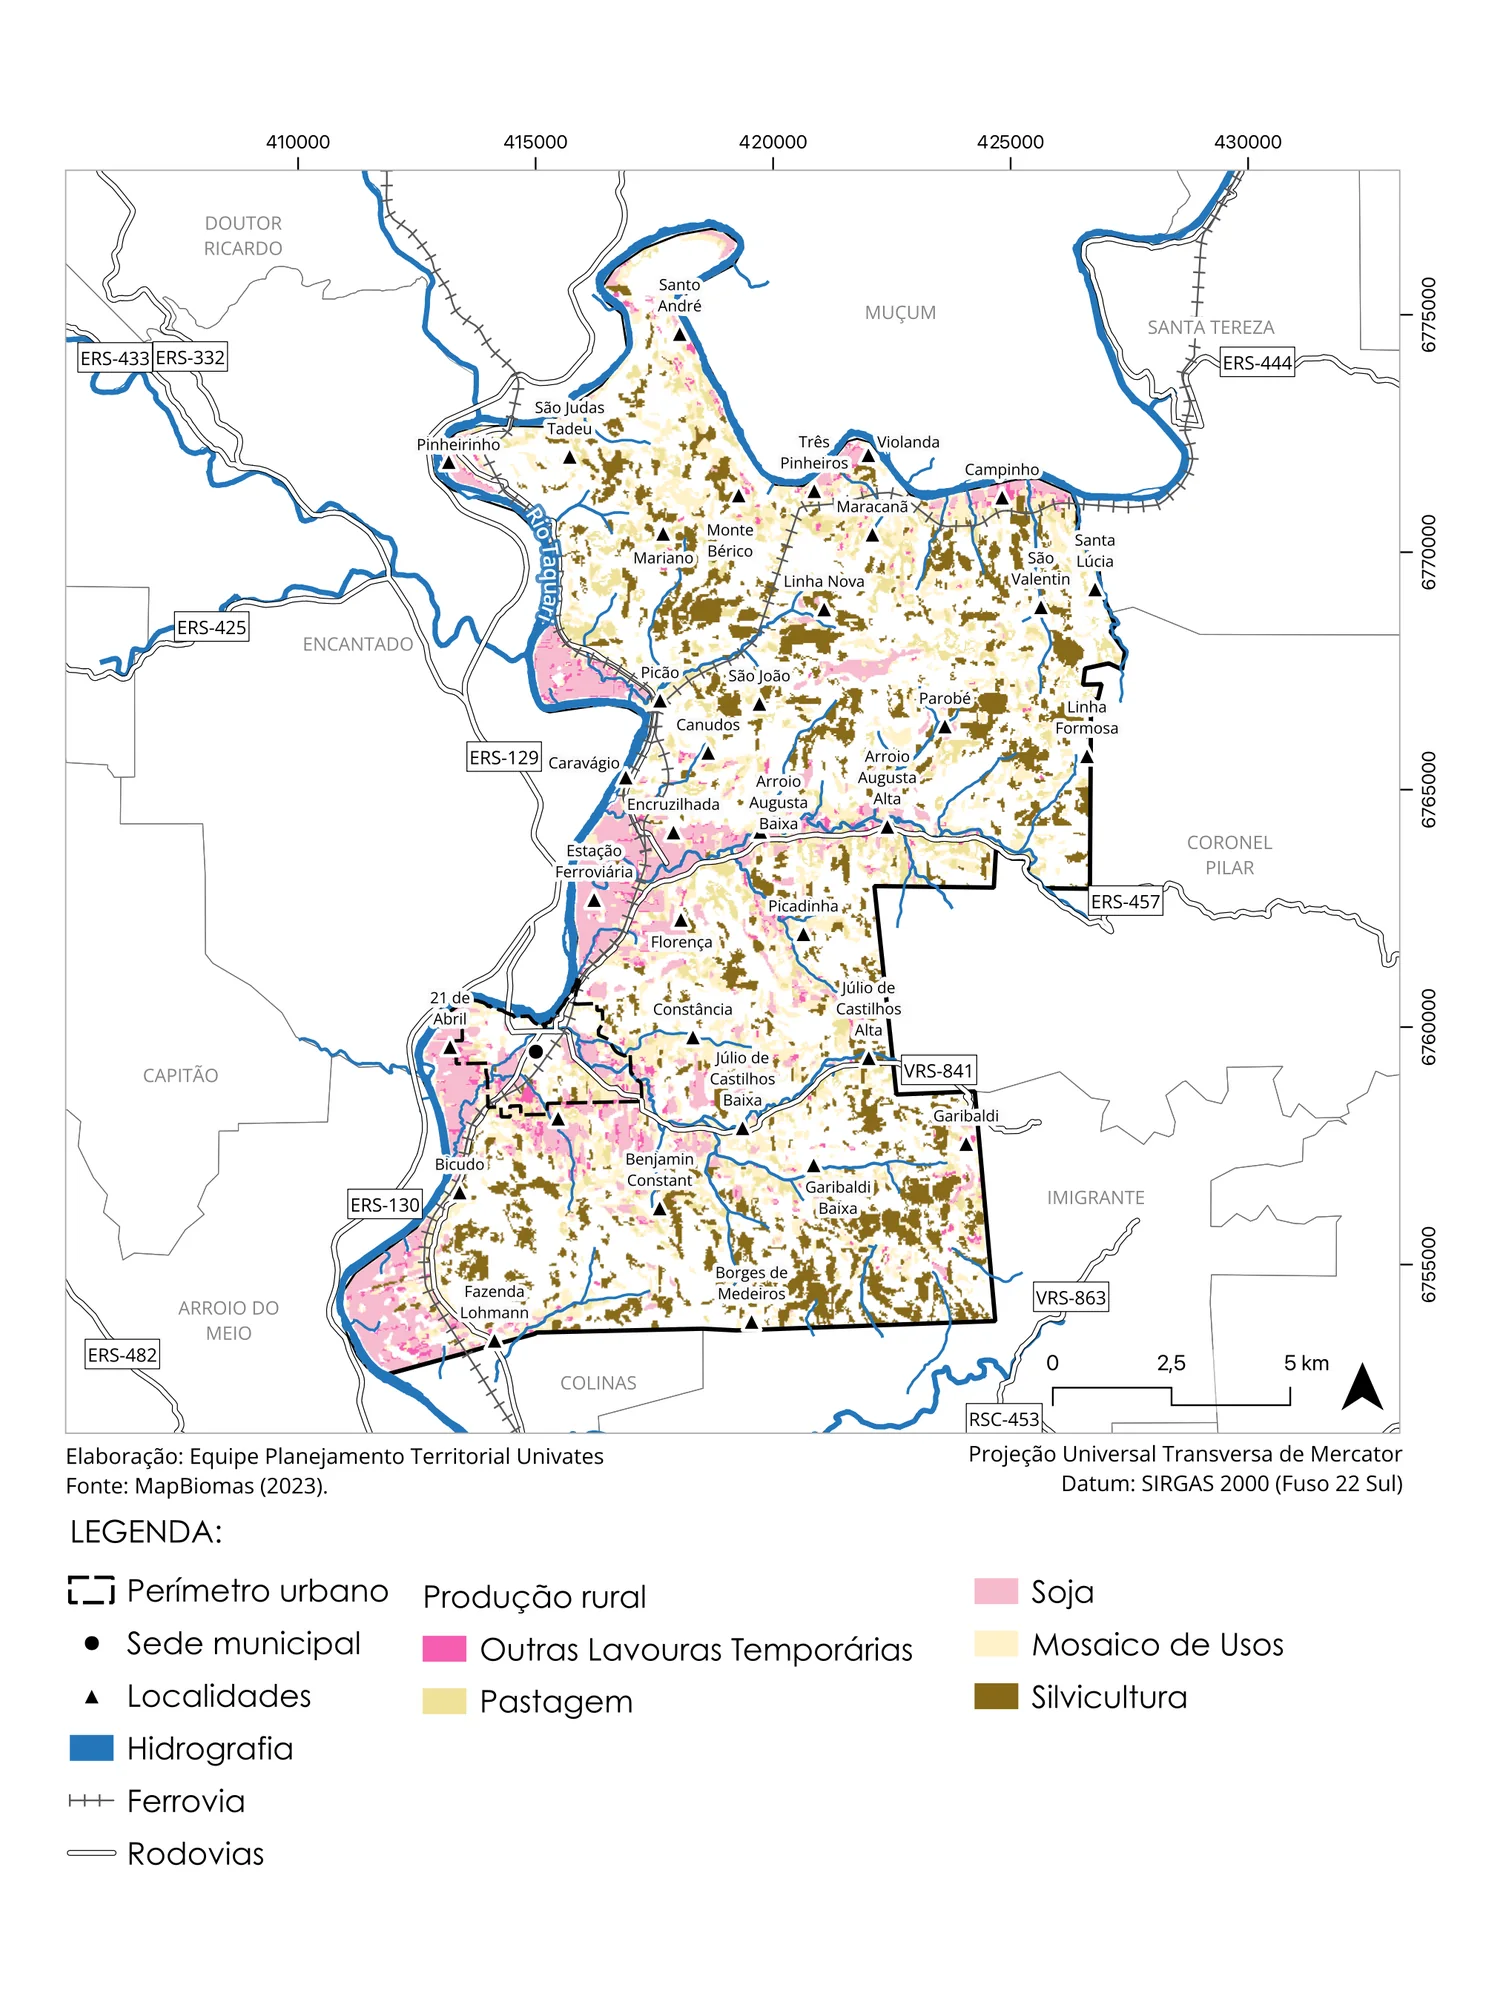
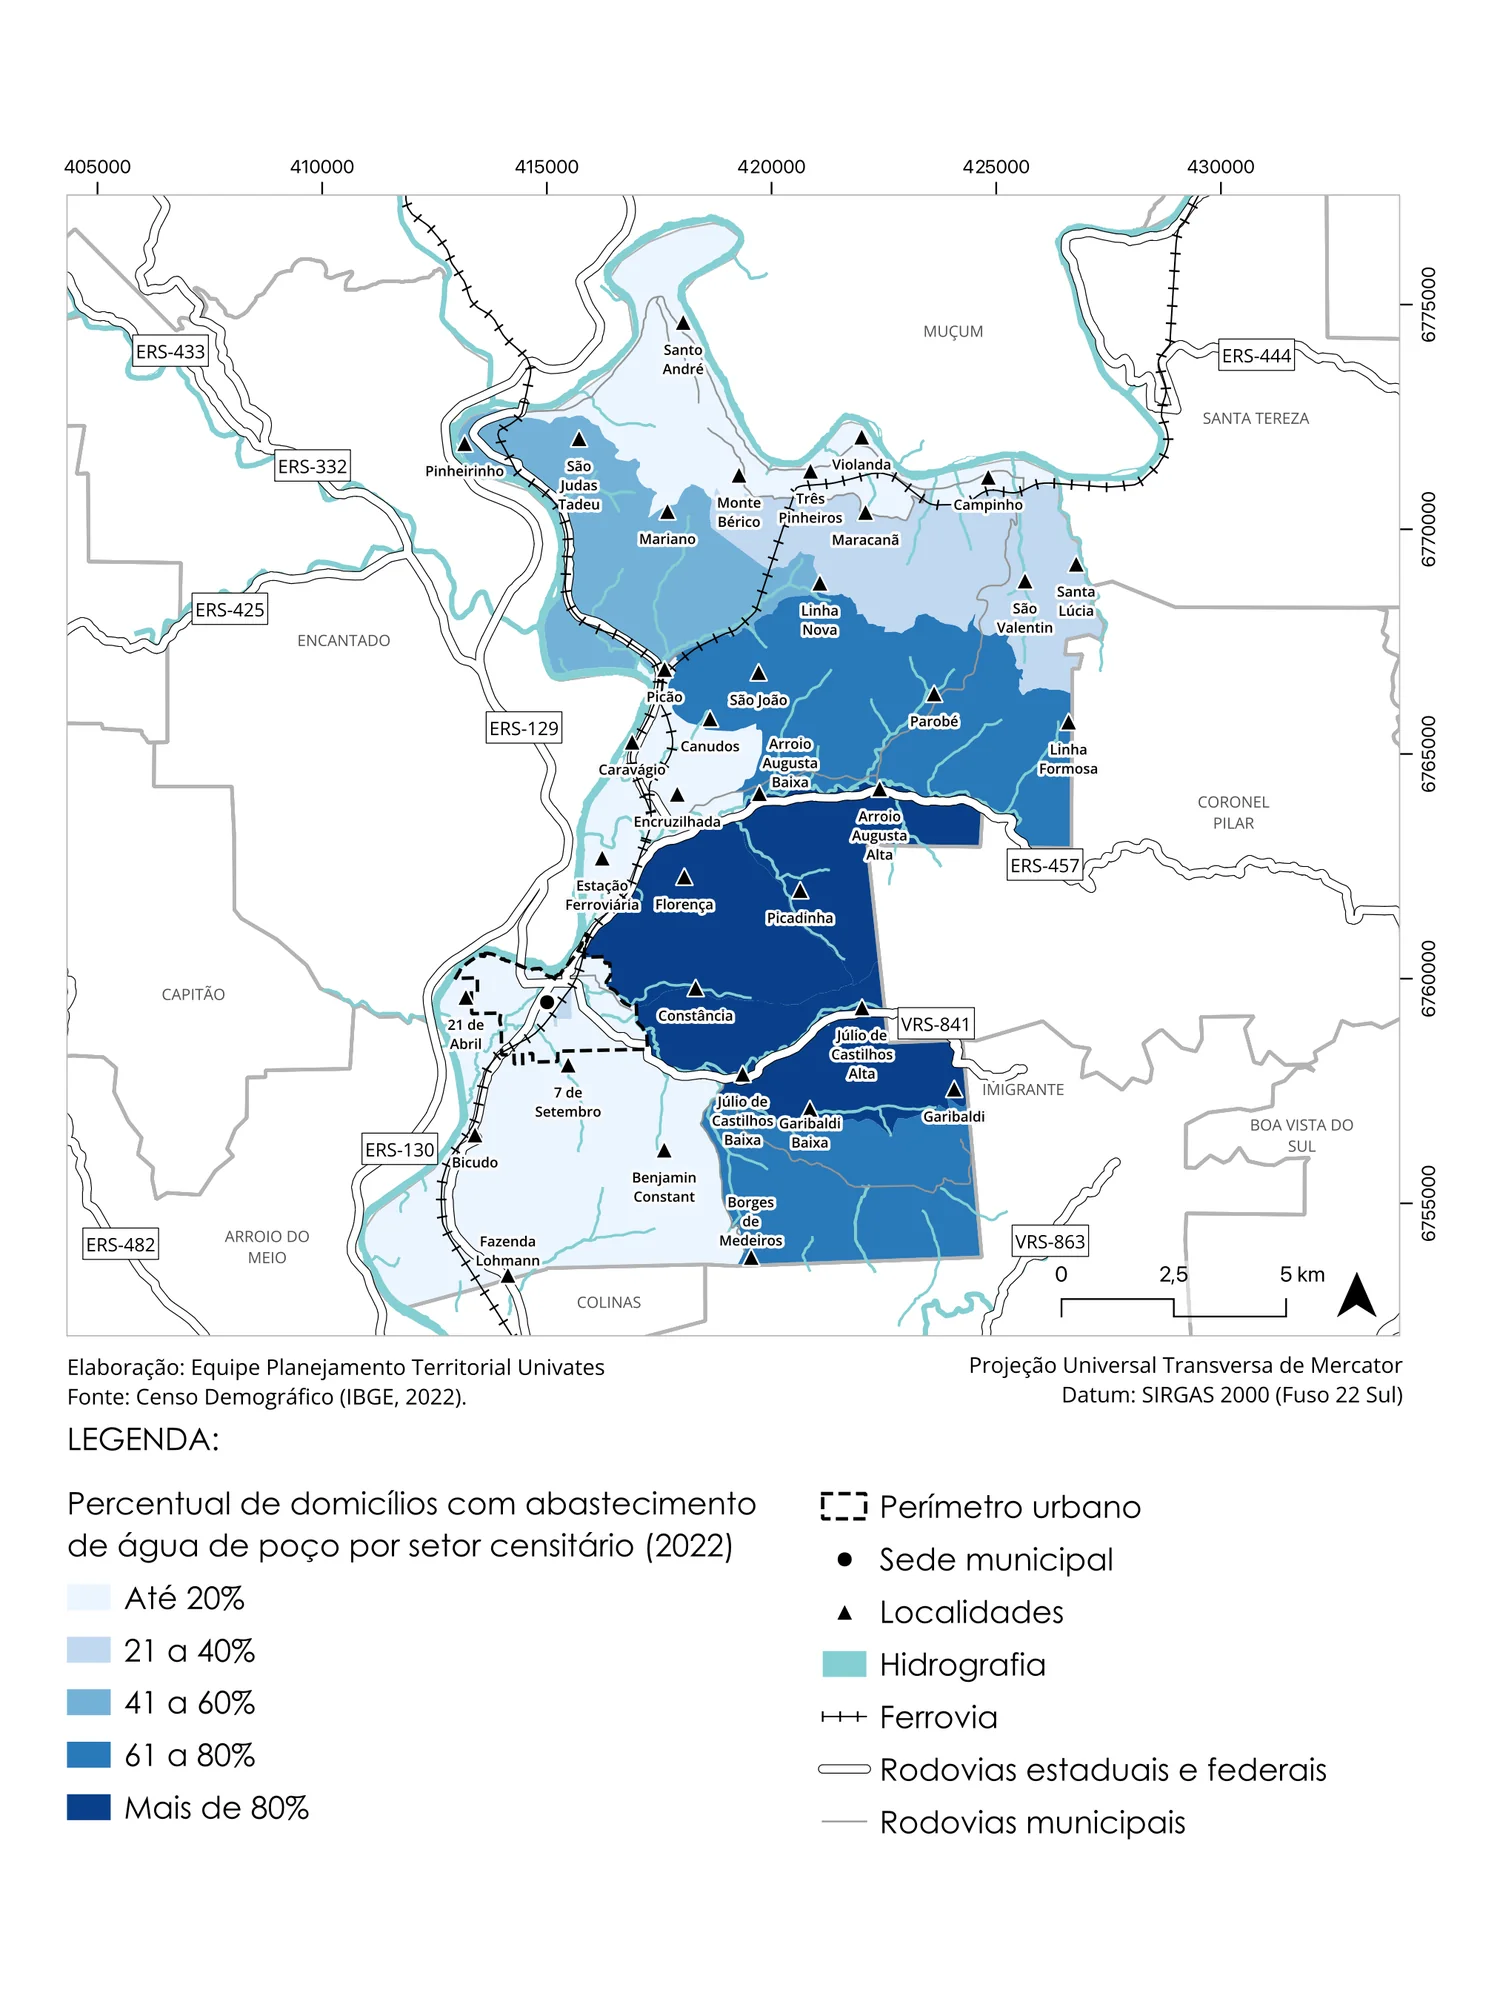
- MapBiomas land cover (2022) · IBGE urbanized areas (2019) · FEPAM/SEMA cartographic base · ANADEM terrain model · UFRGS landslide-scar mapping (May 2024) · IPH/UFRGS hydraulic data
- Tools & methods
- QGIS · Python · Multicriteria analysis · Raster map algebra (10 m)
The challenge#
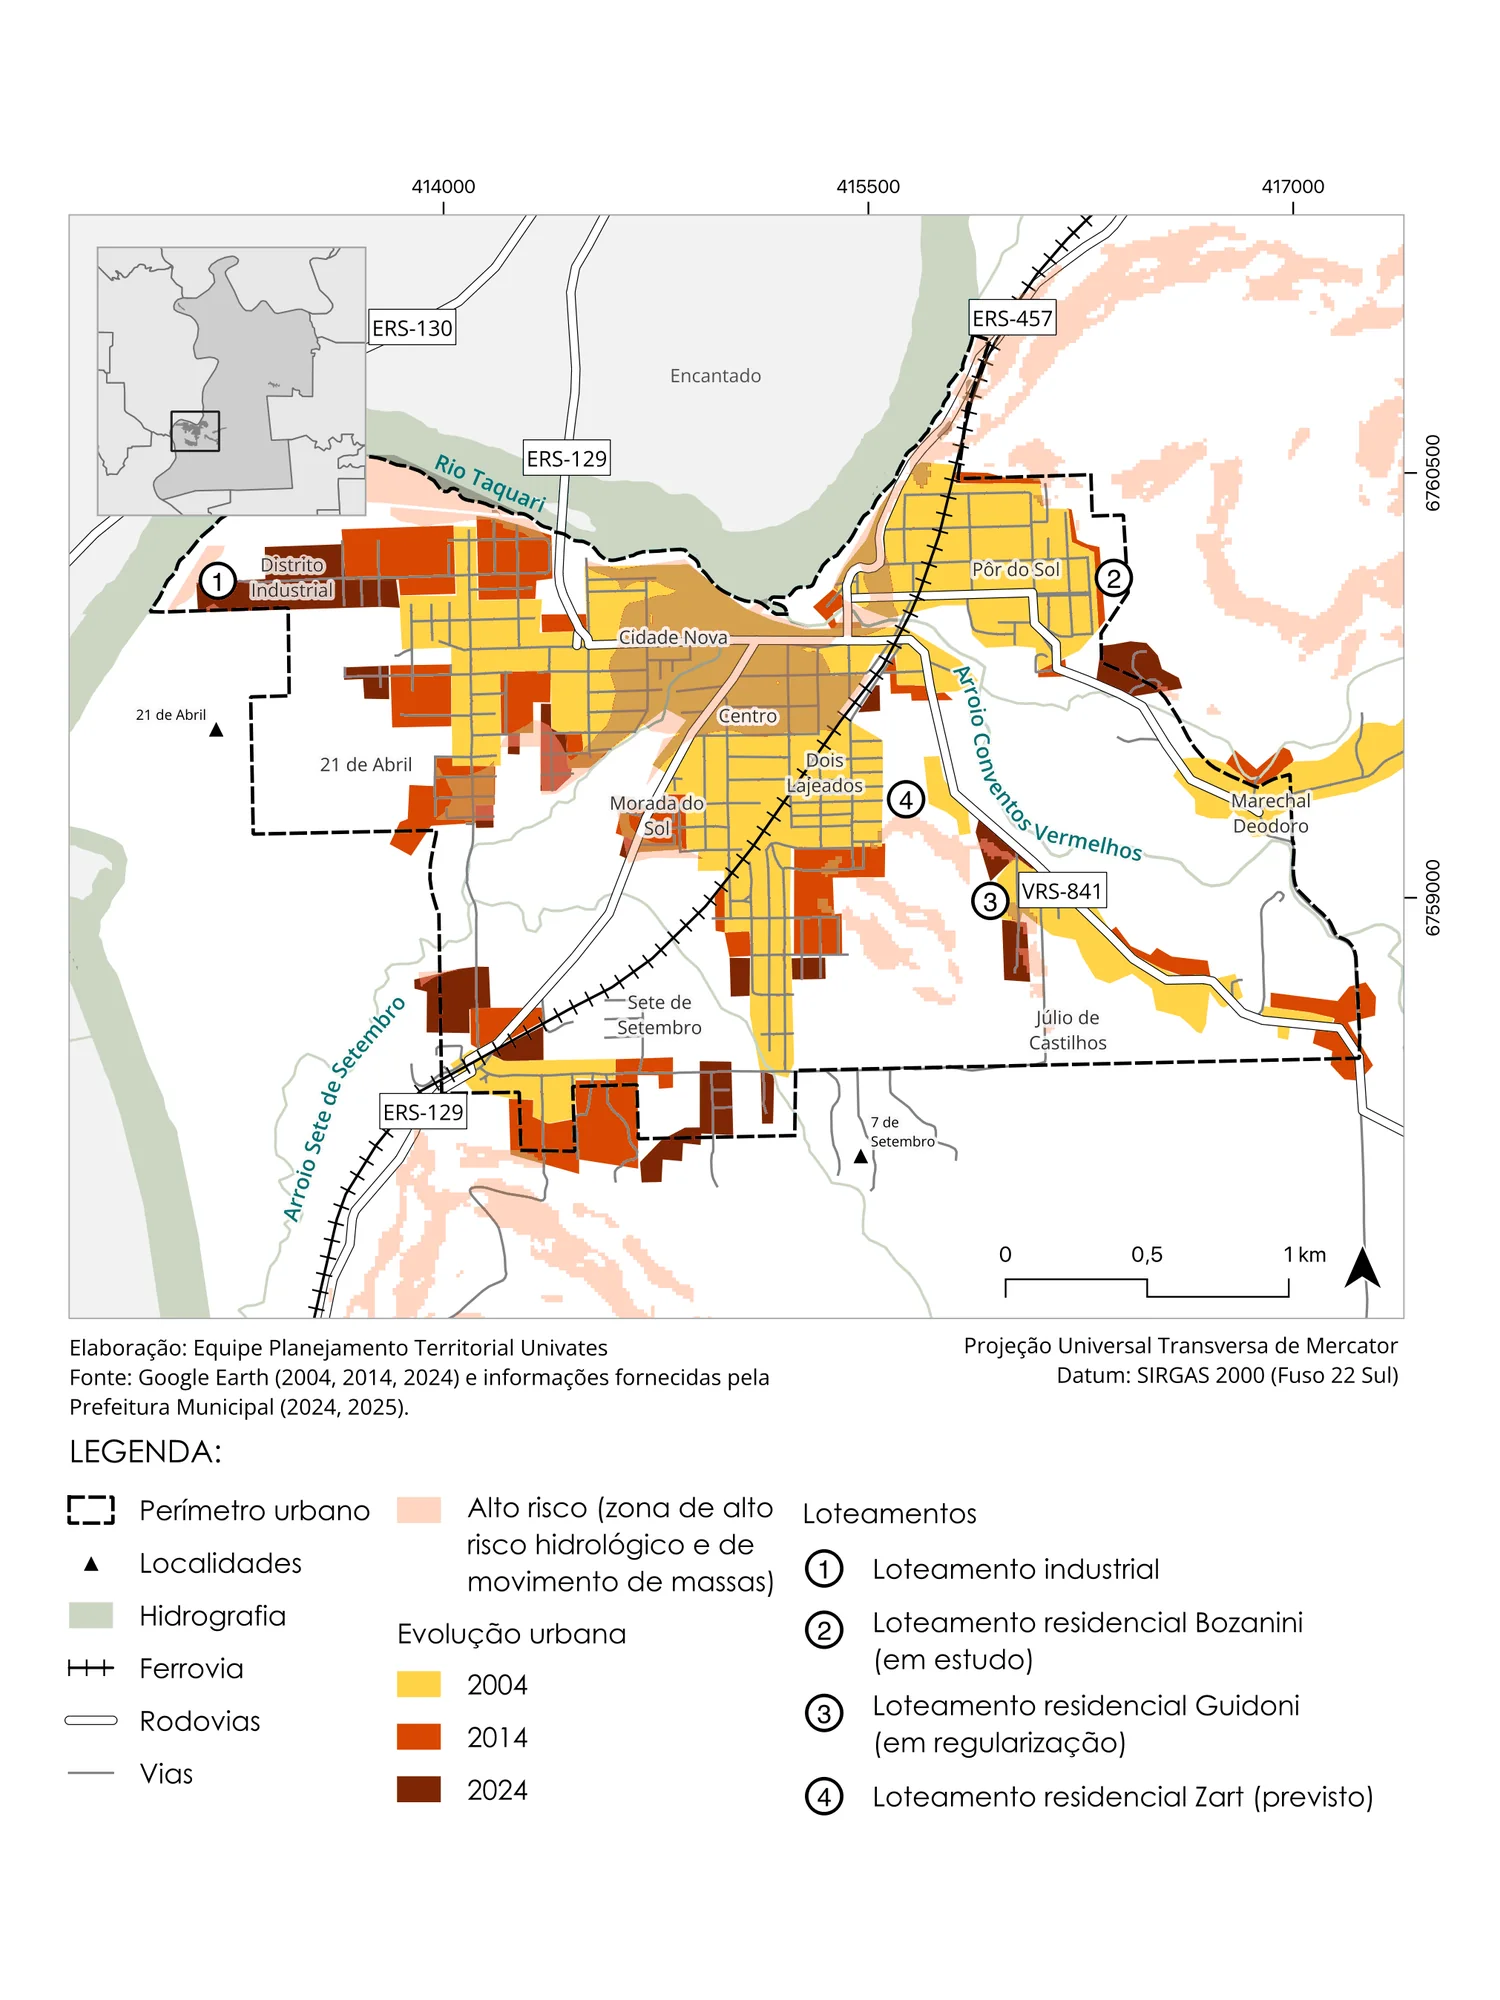
The floods of September and November 2023 and May 2024 wiped out entire neighborhoods in the Taquari Valley. In Muçum, 79% of the population was affected; in Roca Sales, 55%; in Arroio do Meio and Colinas, nearly half. In Cruzeiro do Sul, 600 of the 850 homes in the Passo de Estrela neighborhood were destroyed.
Families needed to be resettled, and municipalities needed answers fast: which land is safe, which is already served by infrastructure, and where should new housing, public facilities and services go first? The State Government commissioned a technical study to support those decisions while the municipal master plans were being revised.
Approach#
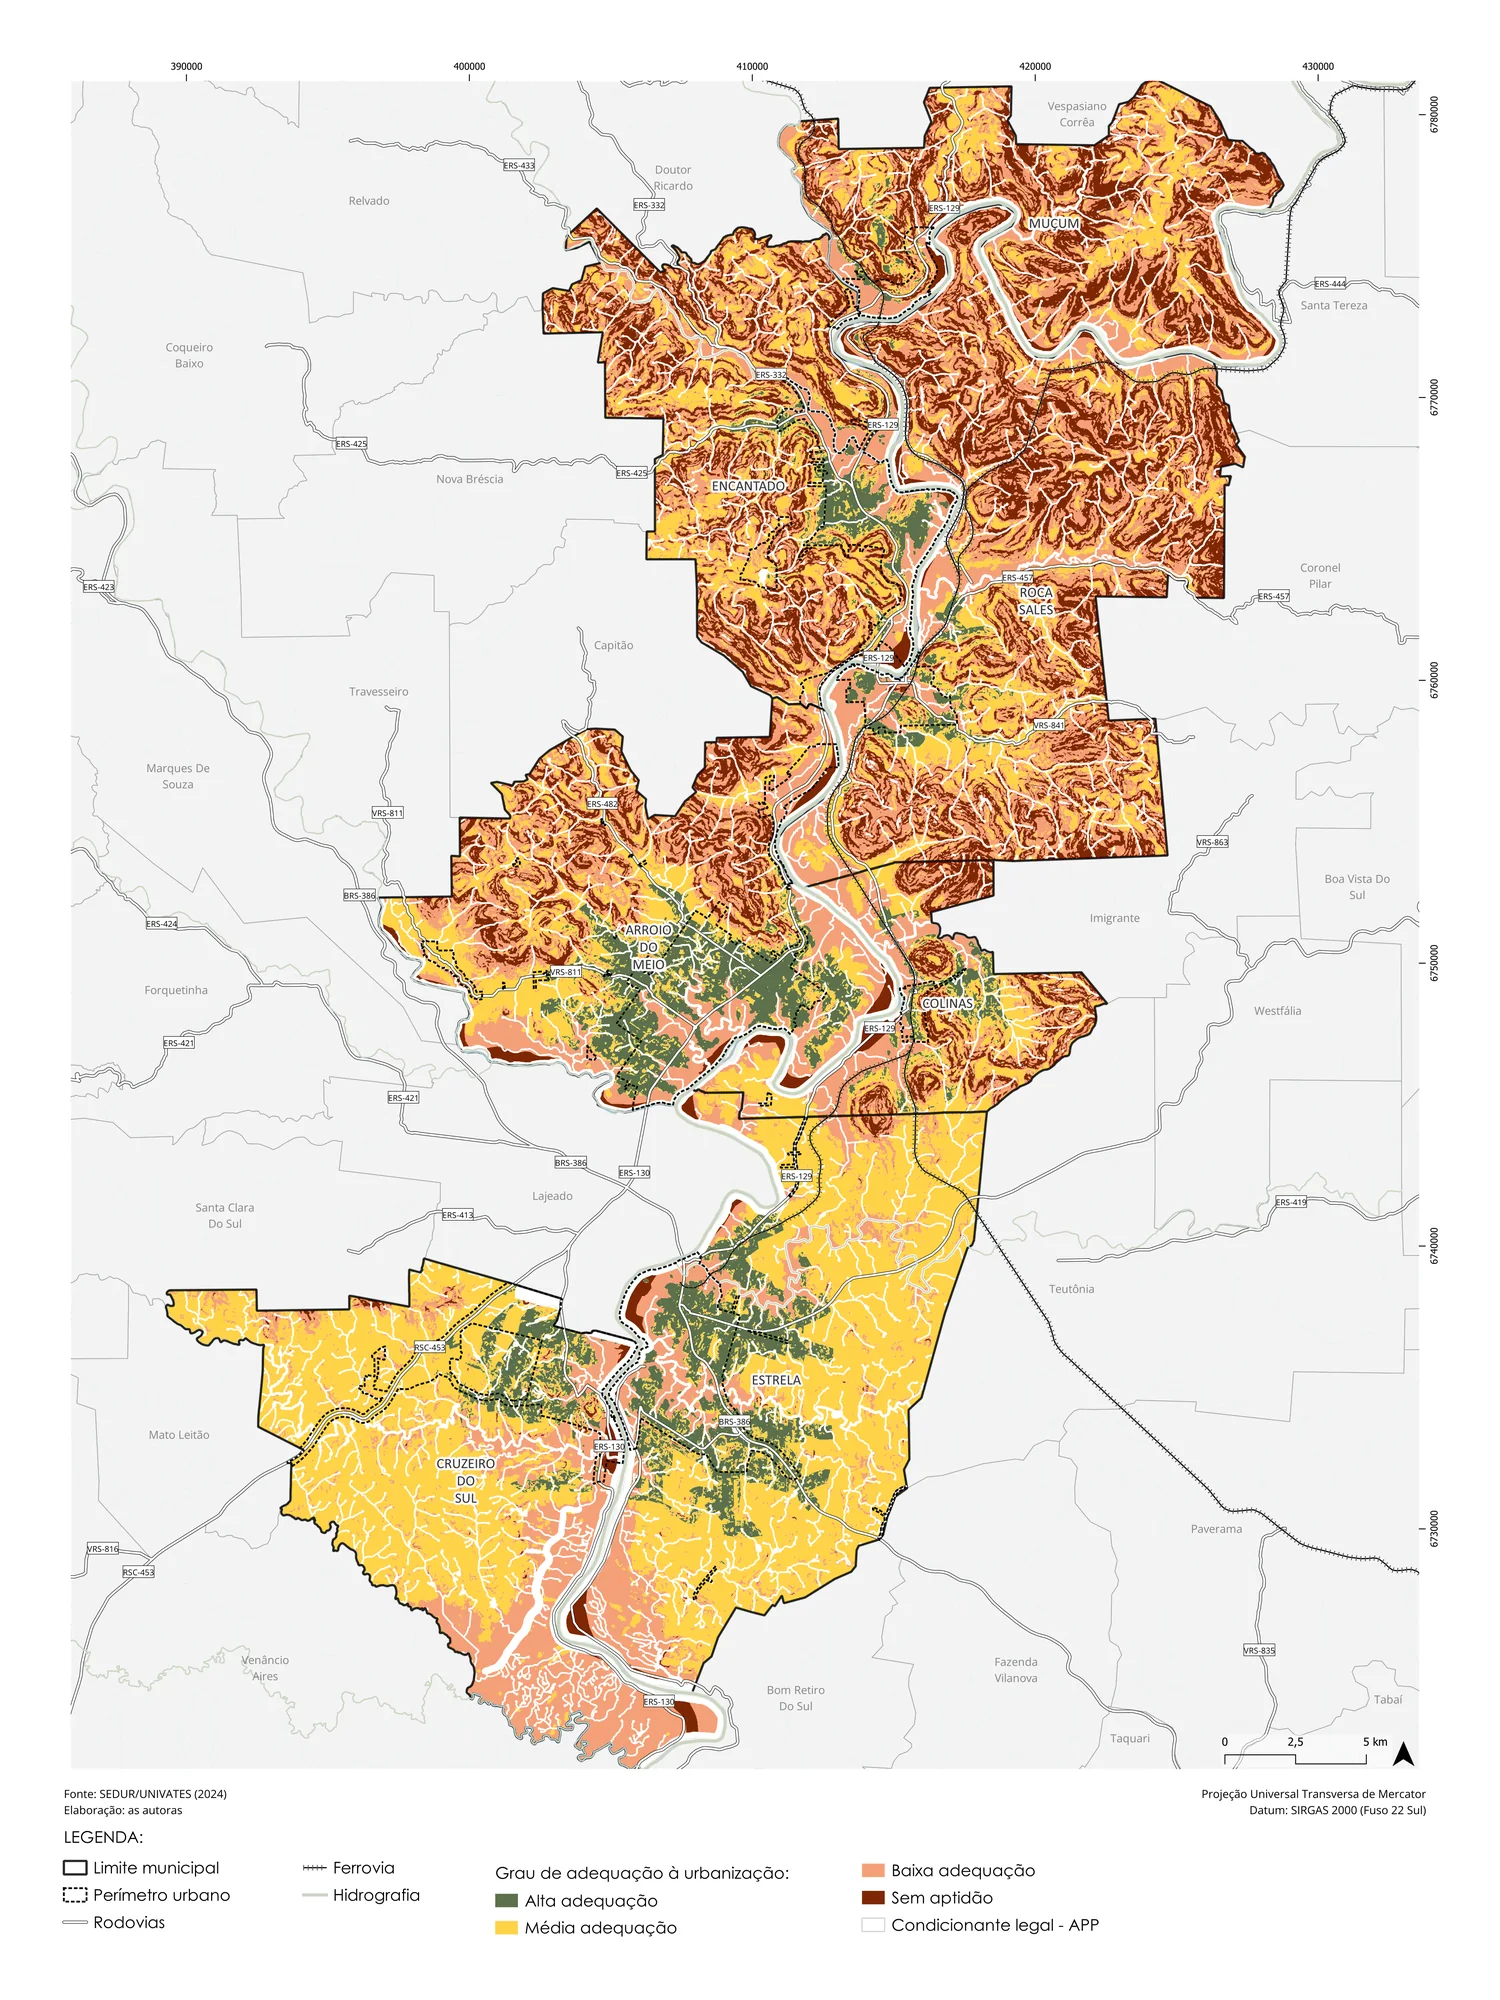
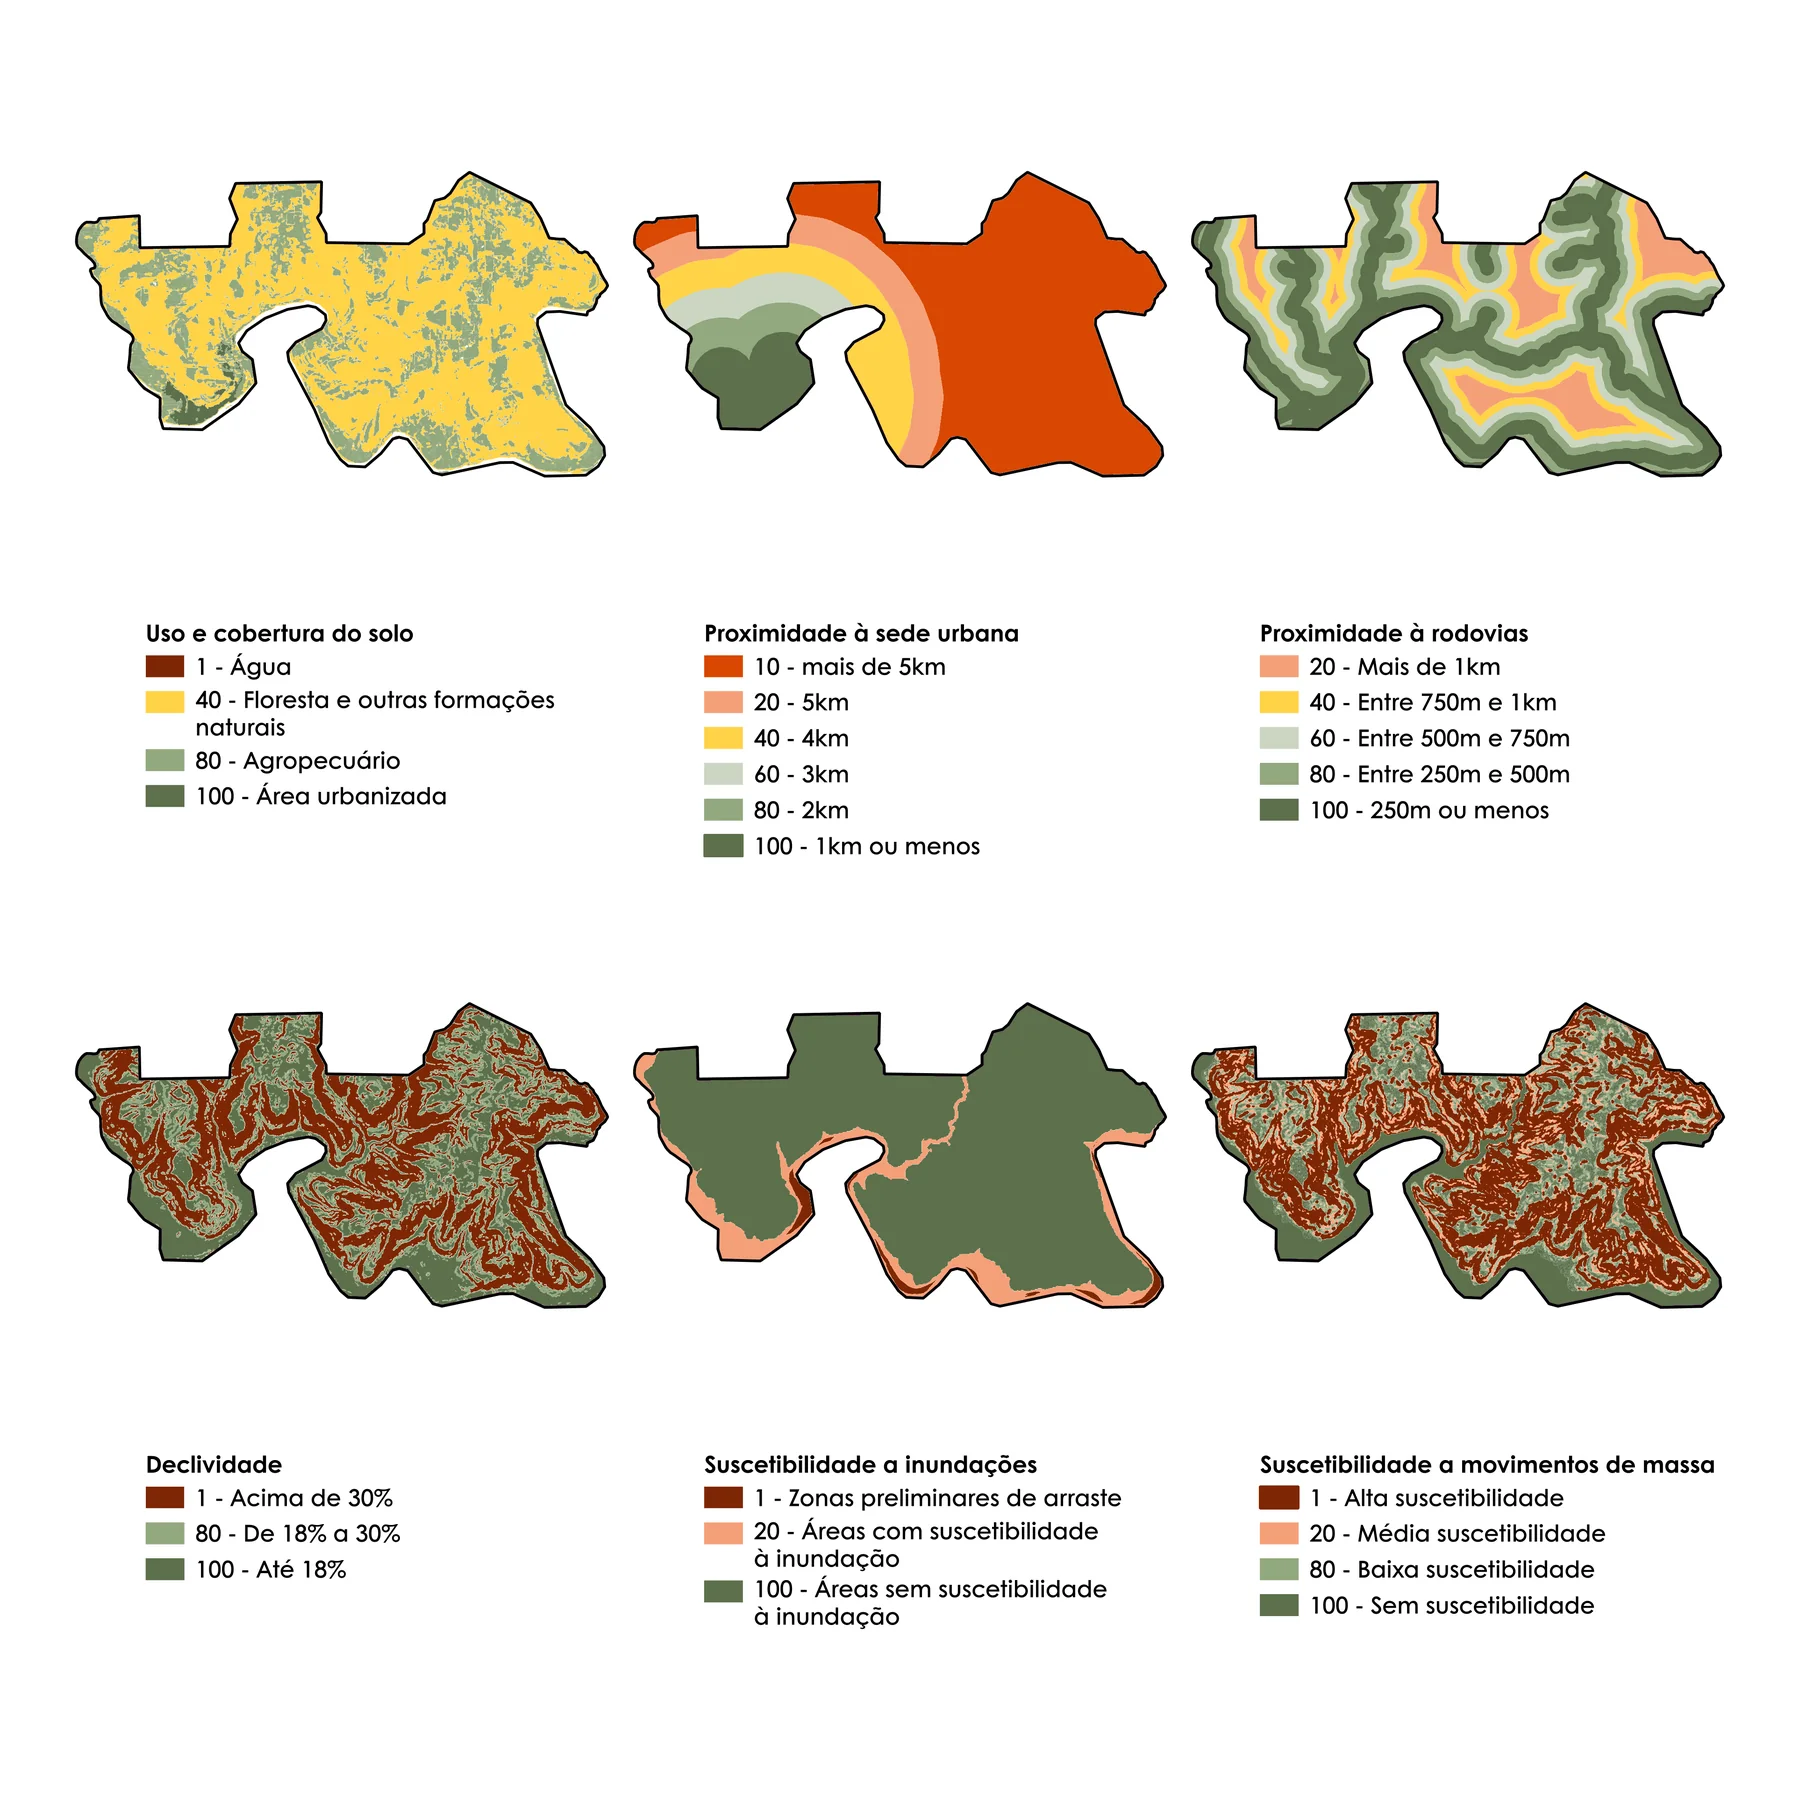
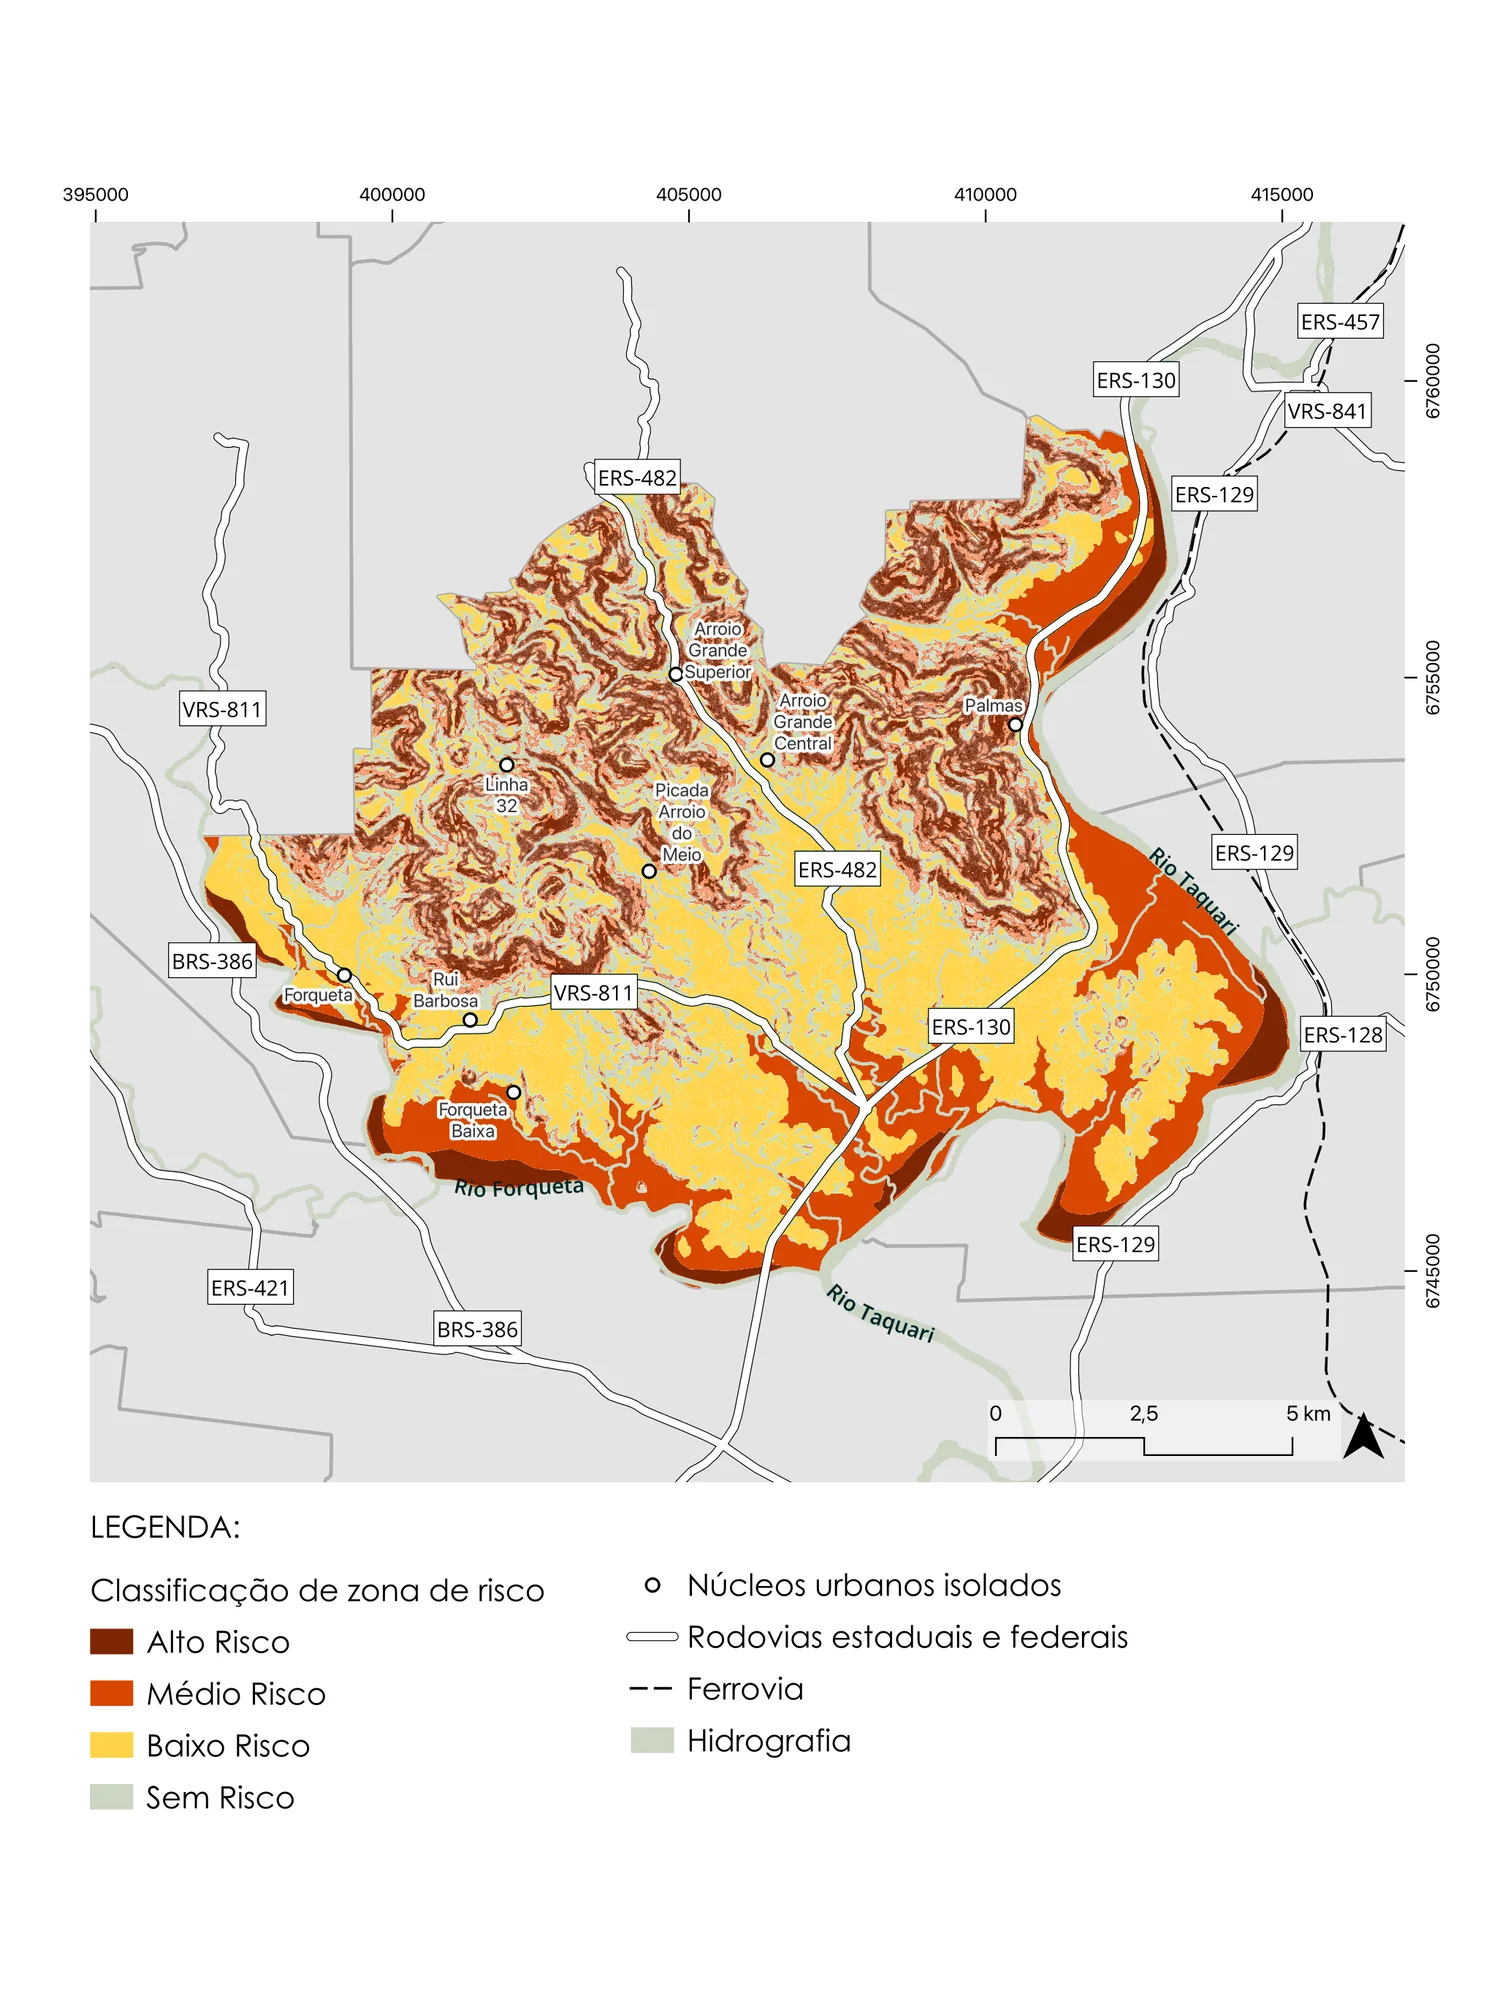
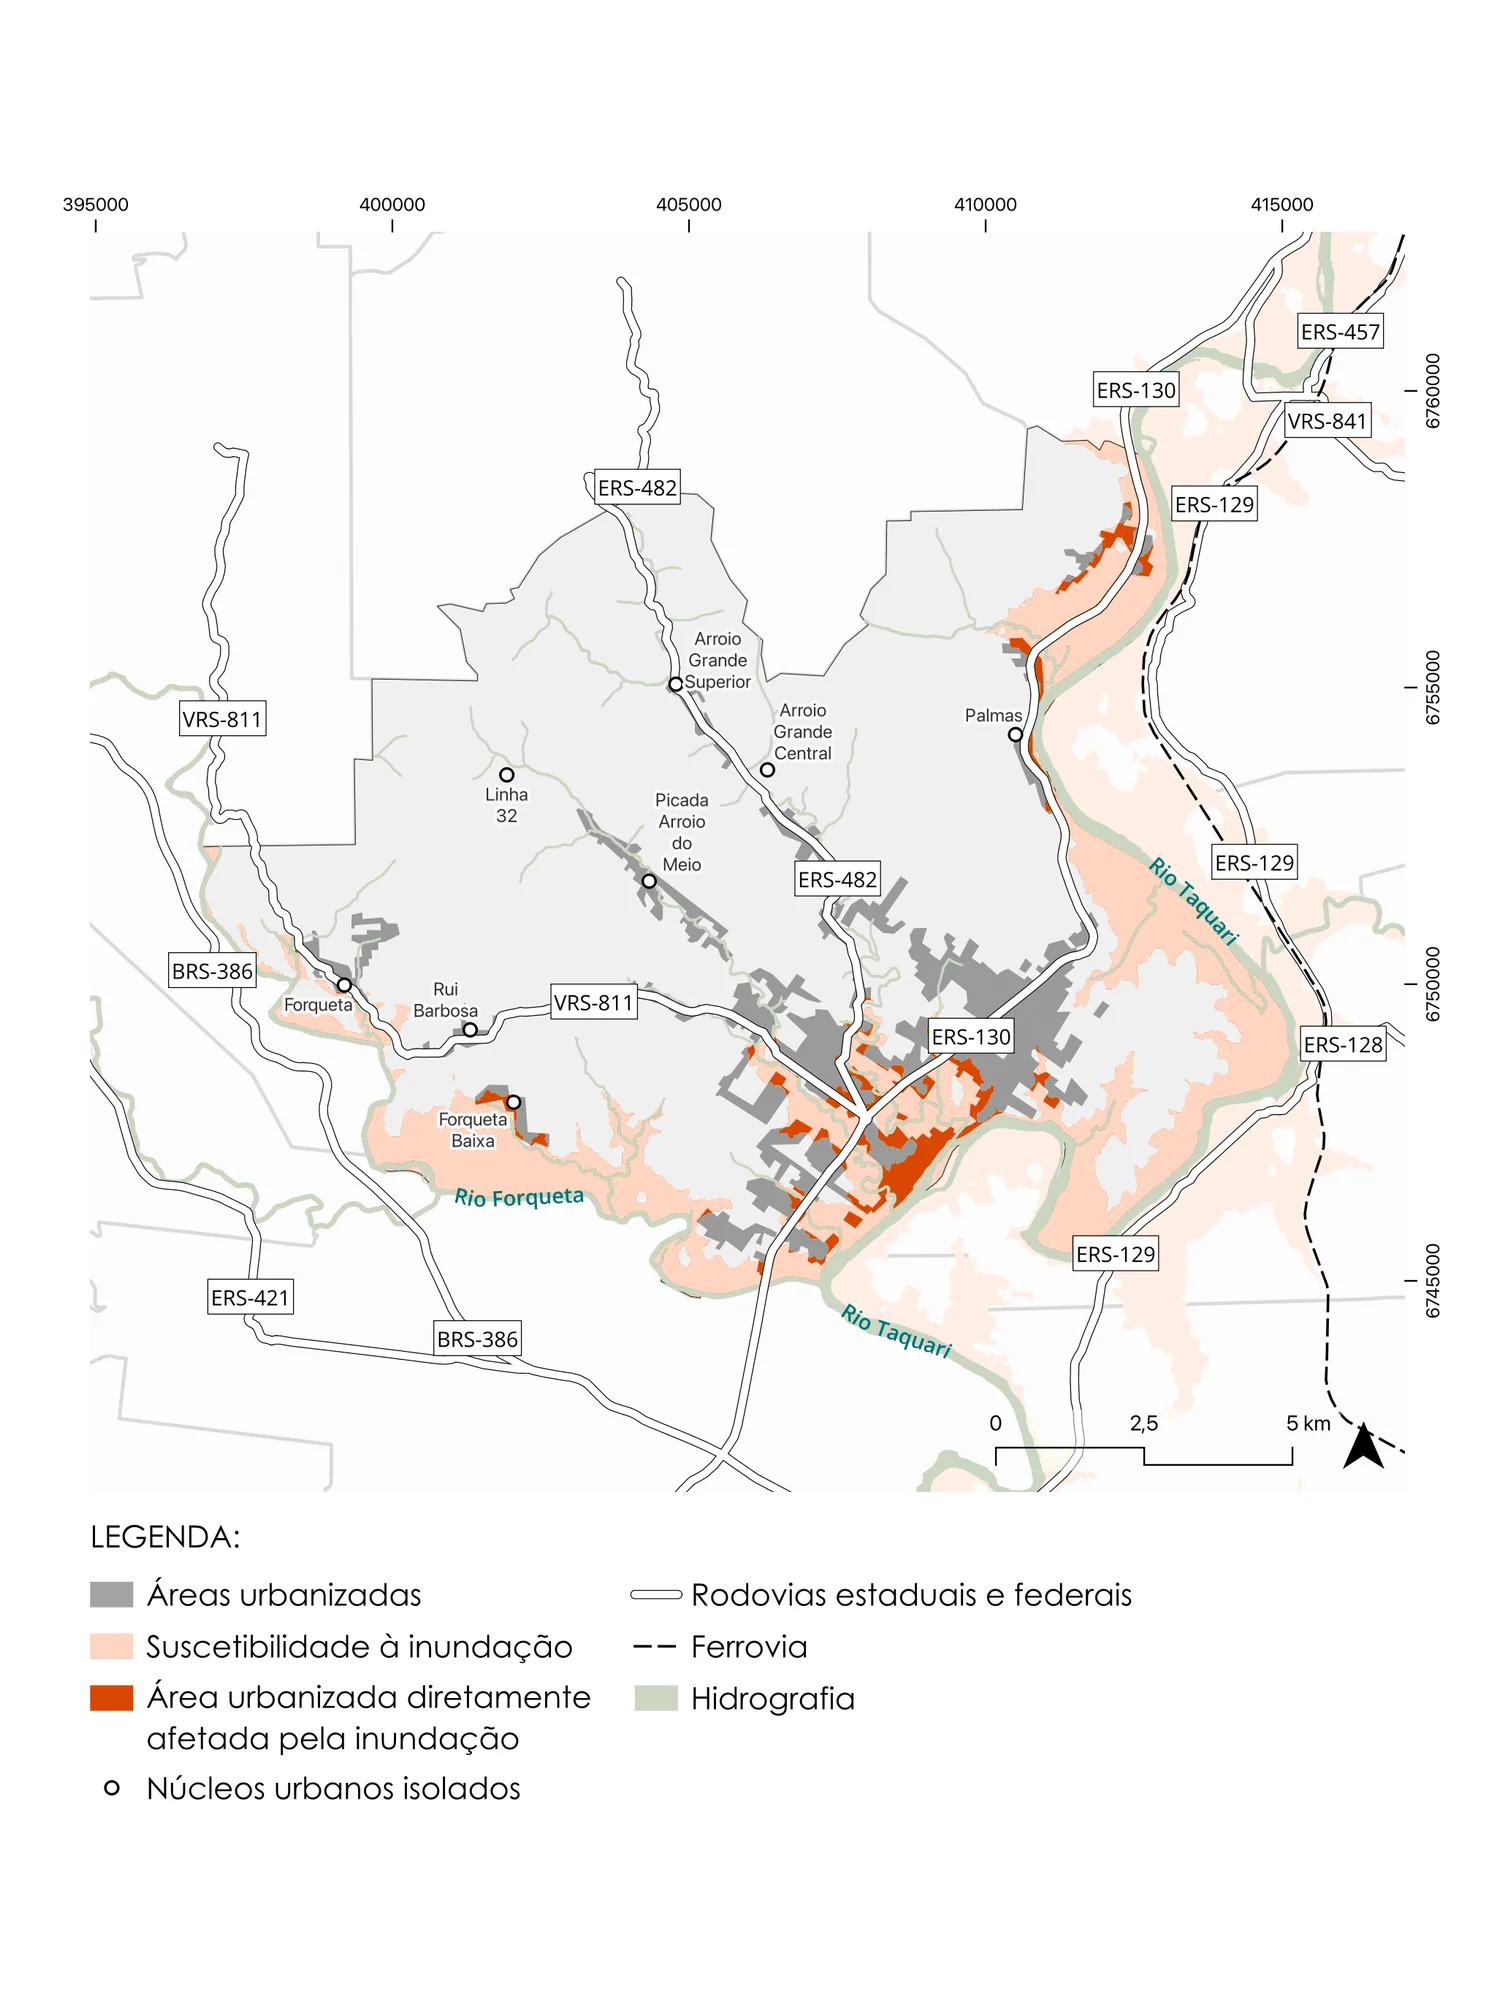
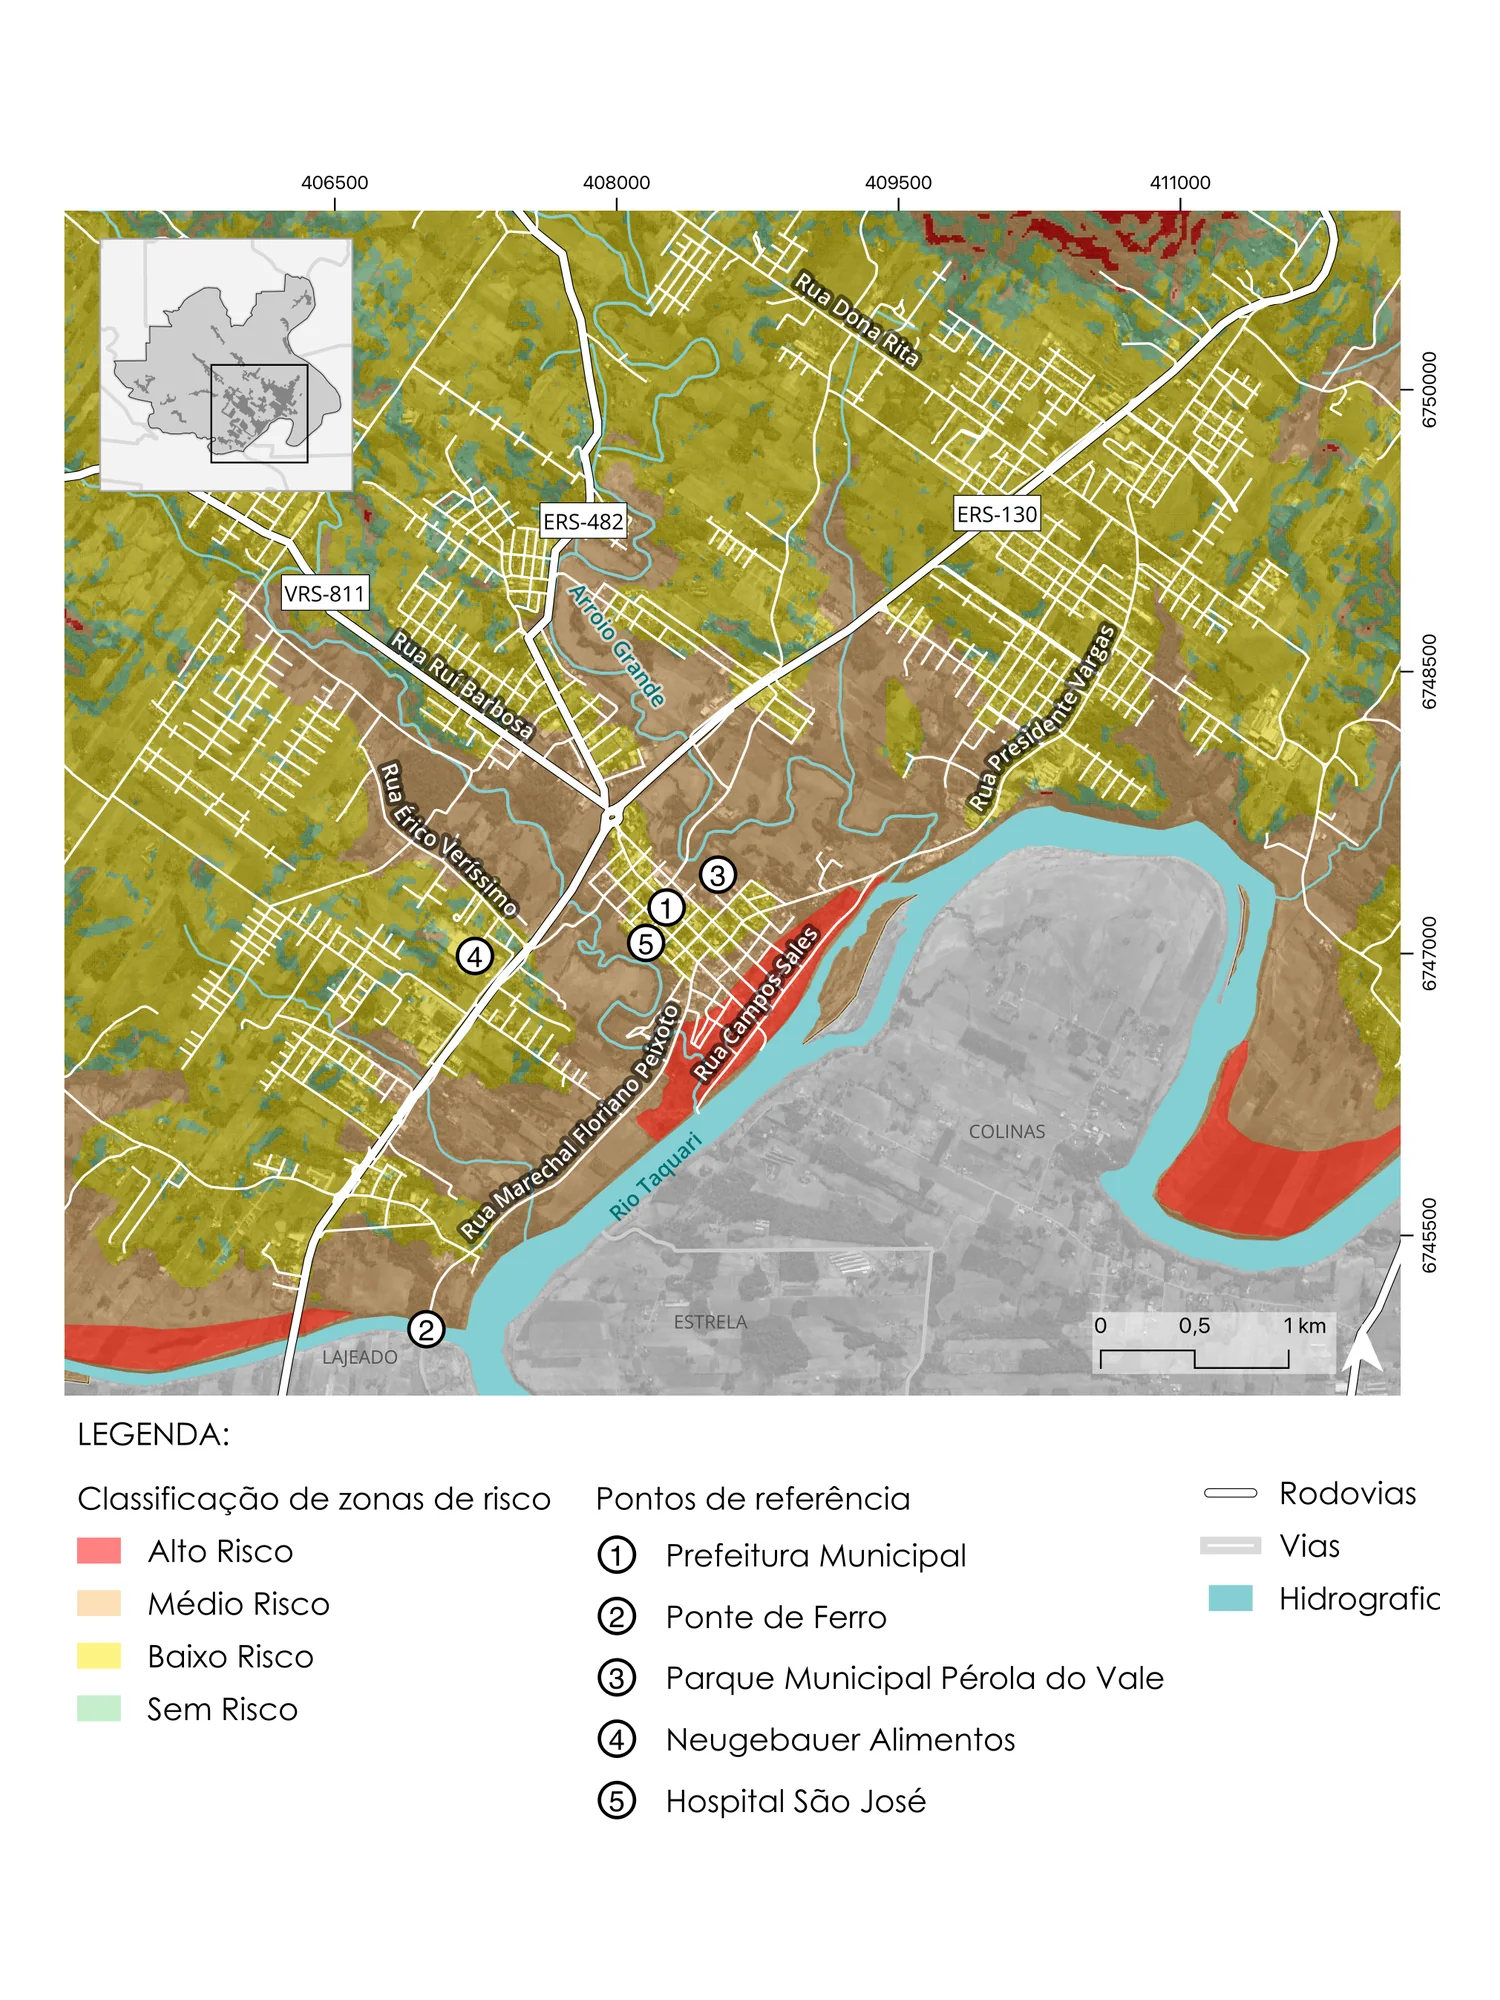
We combined the risk zoning produced for each municipality (flood, flash-flood drag zones and landslide susceptibility) with a multicriteria suitability model. Every 10 m cell of each municipality received a score from 1 to 100 indicating how suitable it is for new urban occupation.
- Restrictions
- Permanent Preservation Areas (Forest Code)
- Risk zones: high (0.1), medium (0.4), low (0.8), none (1)
- Factors
- Land cover: urban 100, agriculture 80, natural 40
- Distance to the urban core (1 km bands)
- Distance to roads (250 m bands)
- Slope: >30% excluded by law
- Map algebra
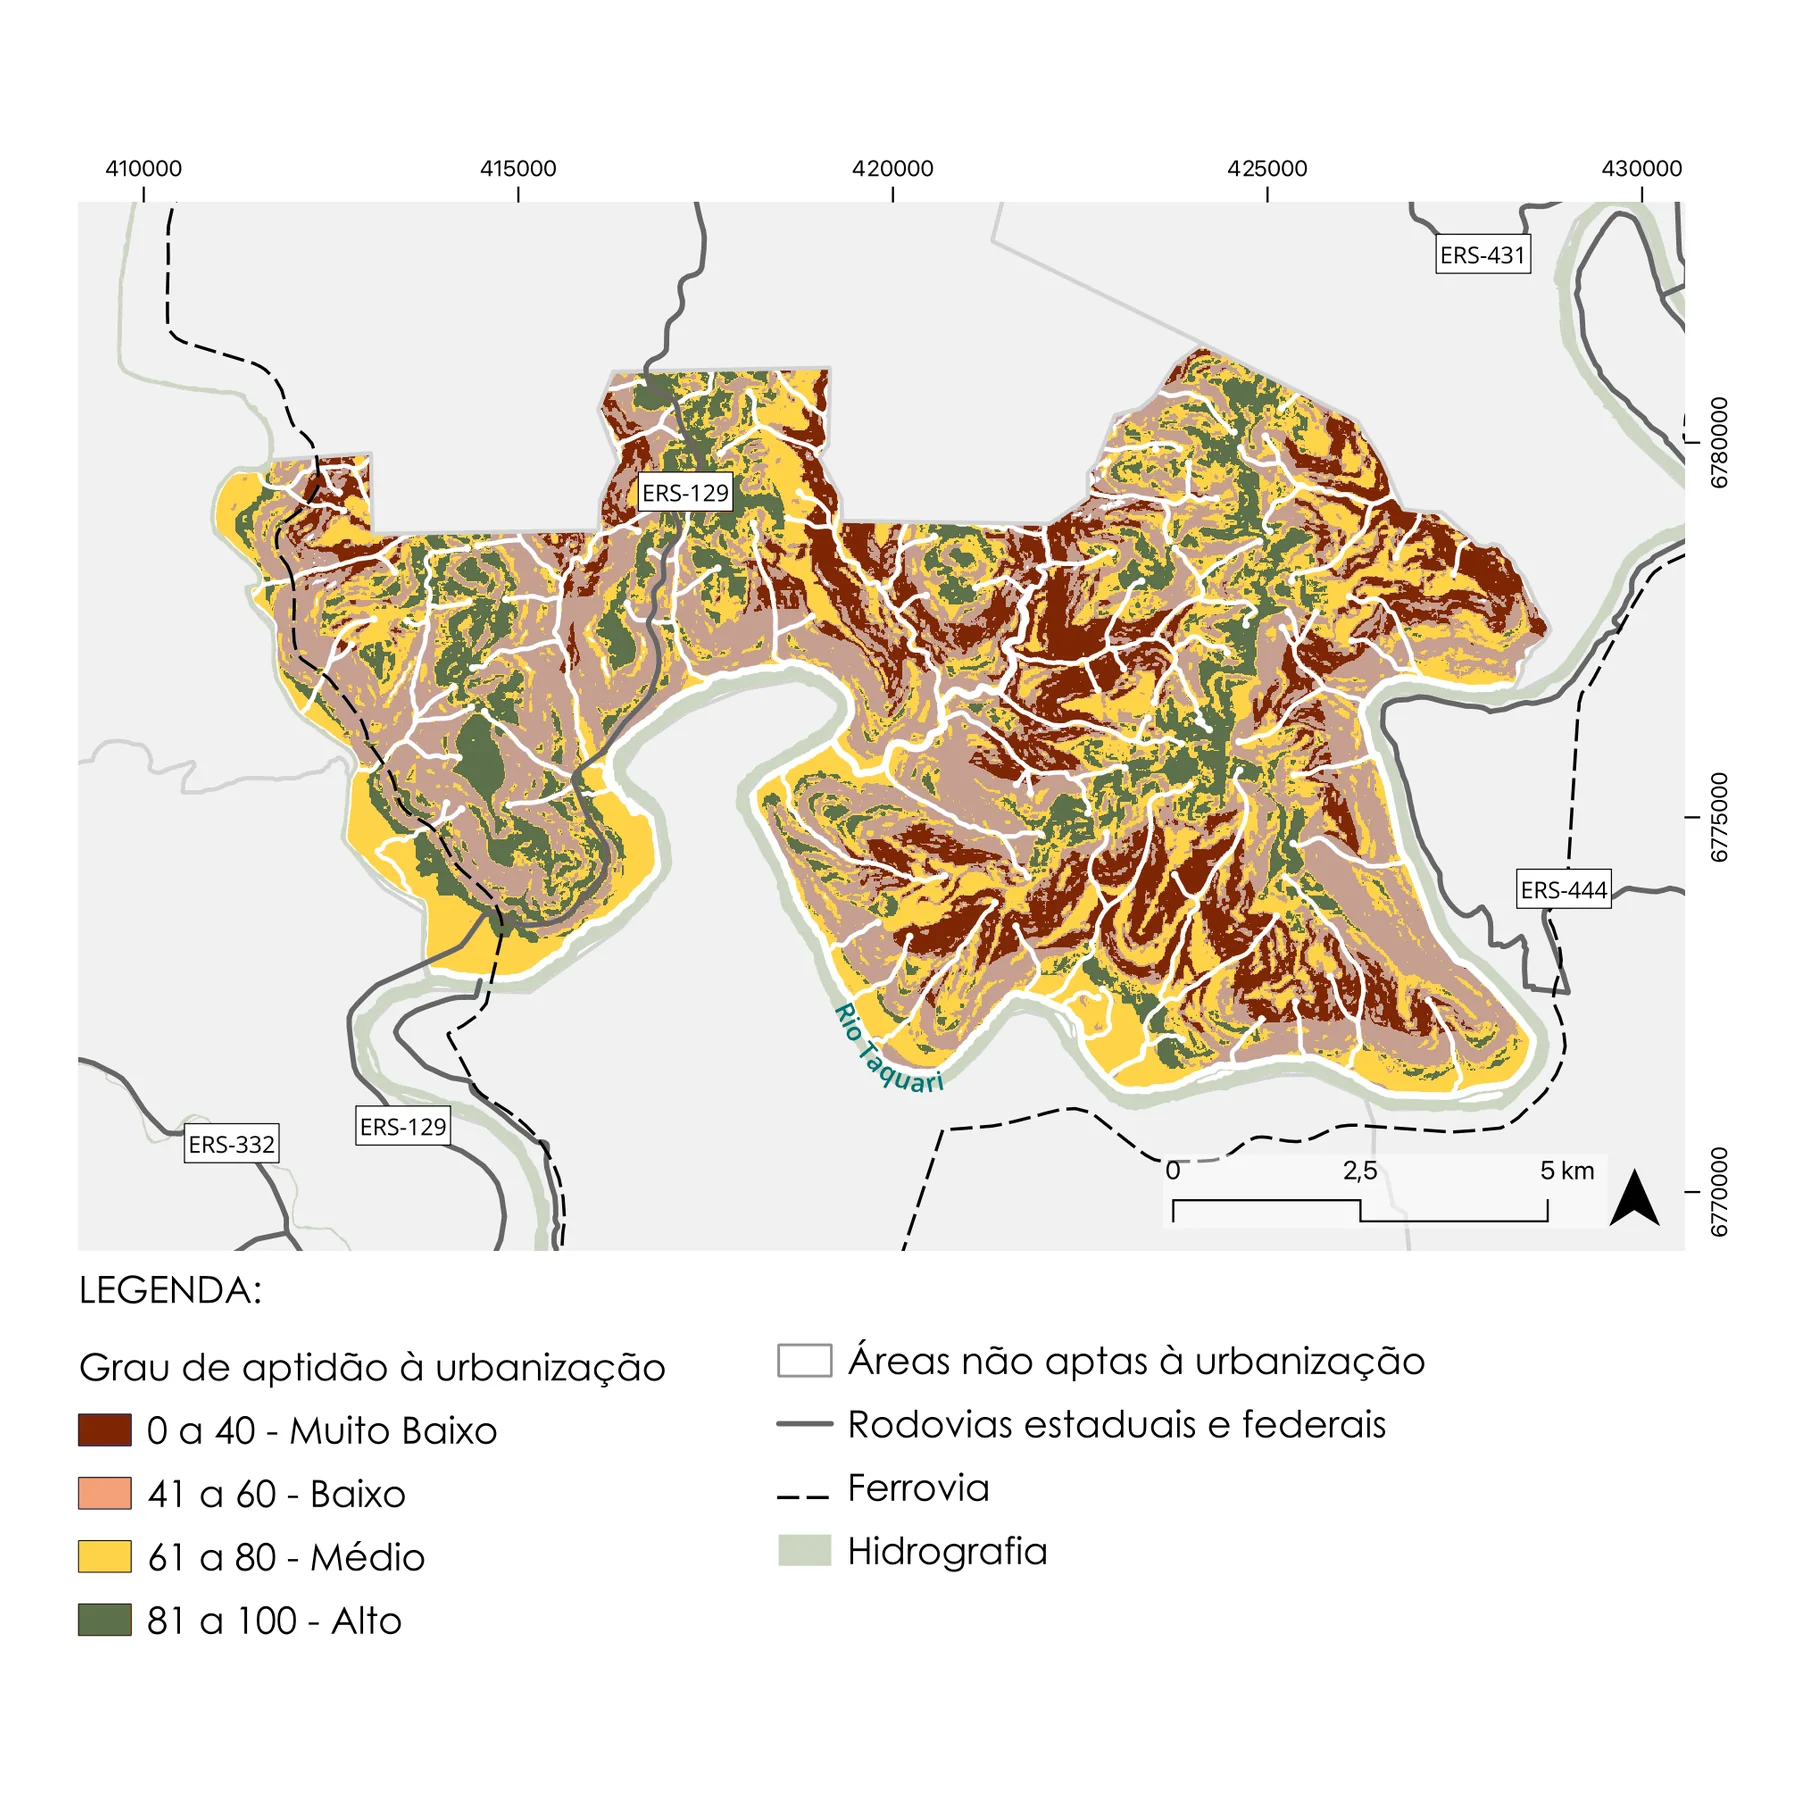
Weighted mean of the four factors × risk restriction → suitability surface (very low to high)
- Guidelines
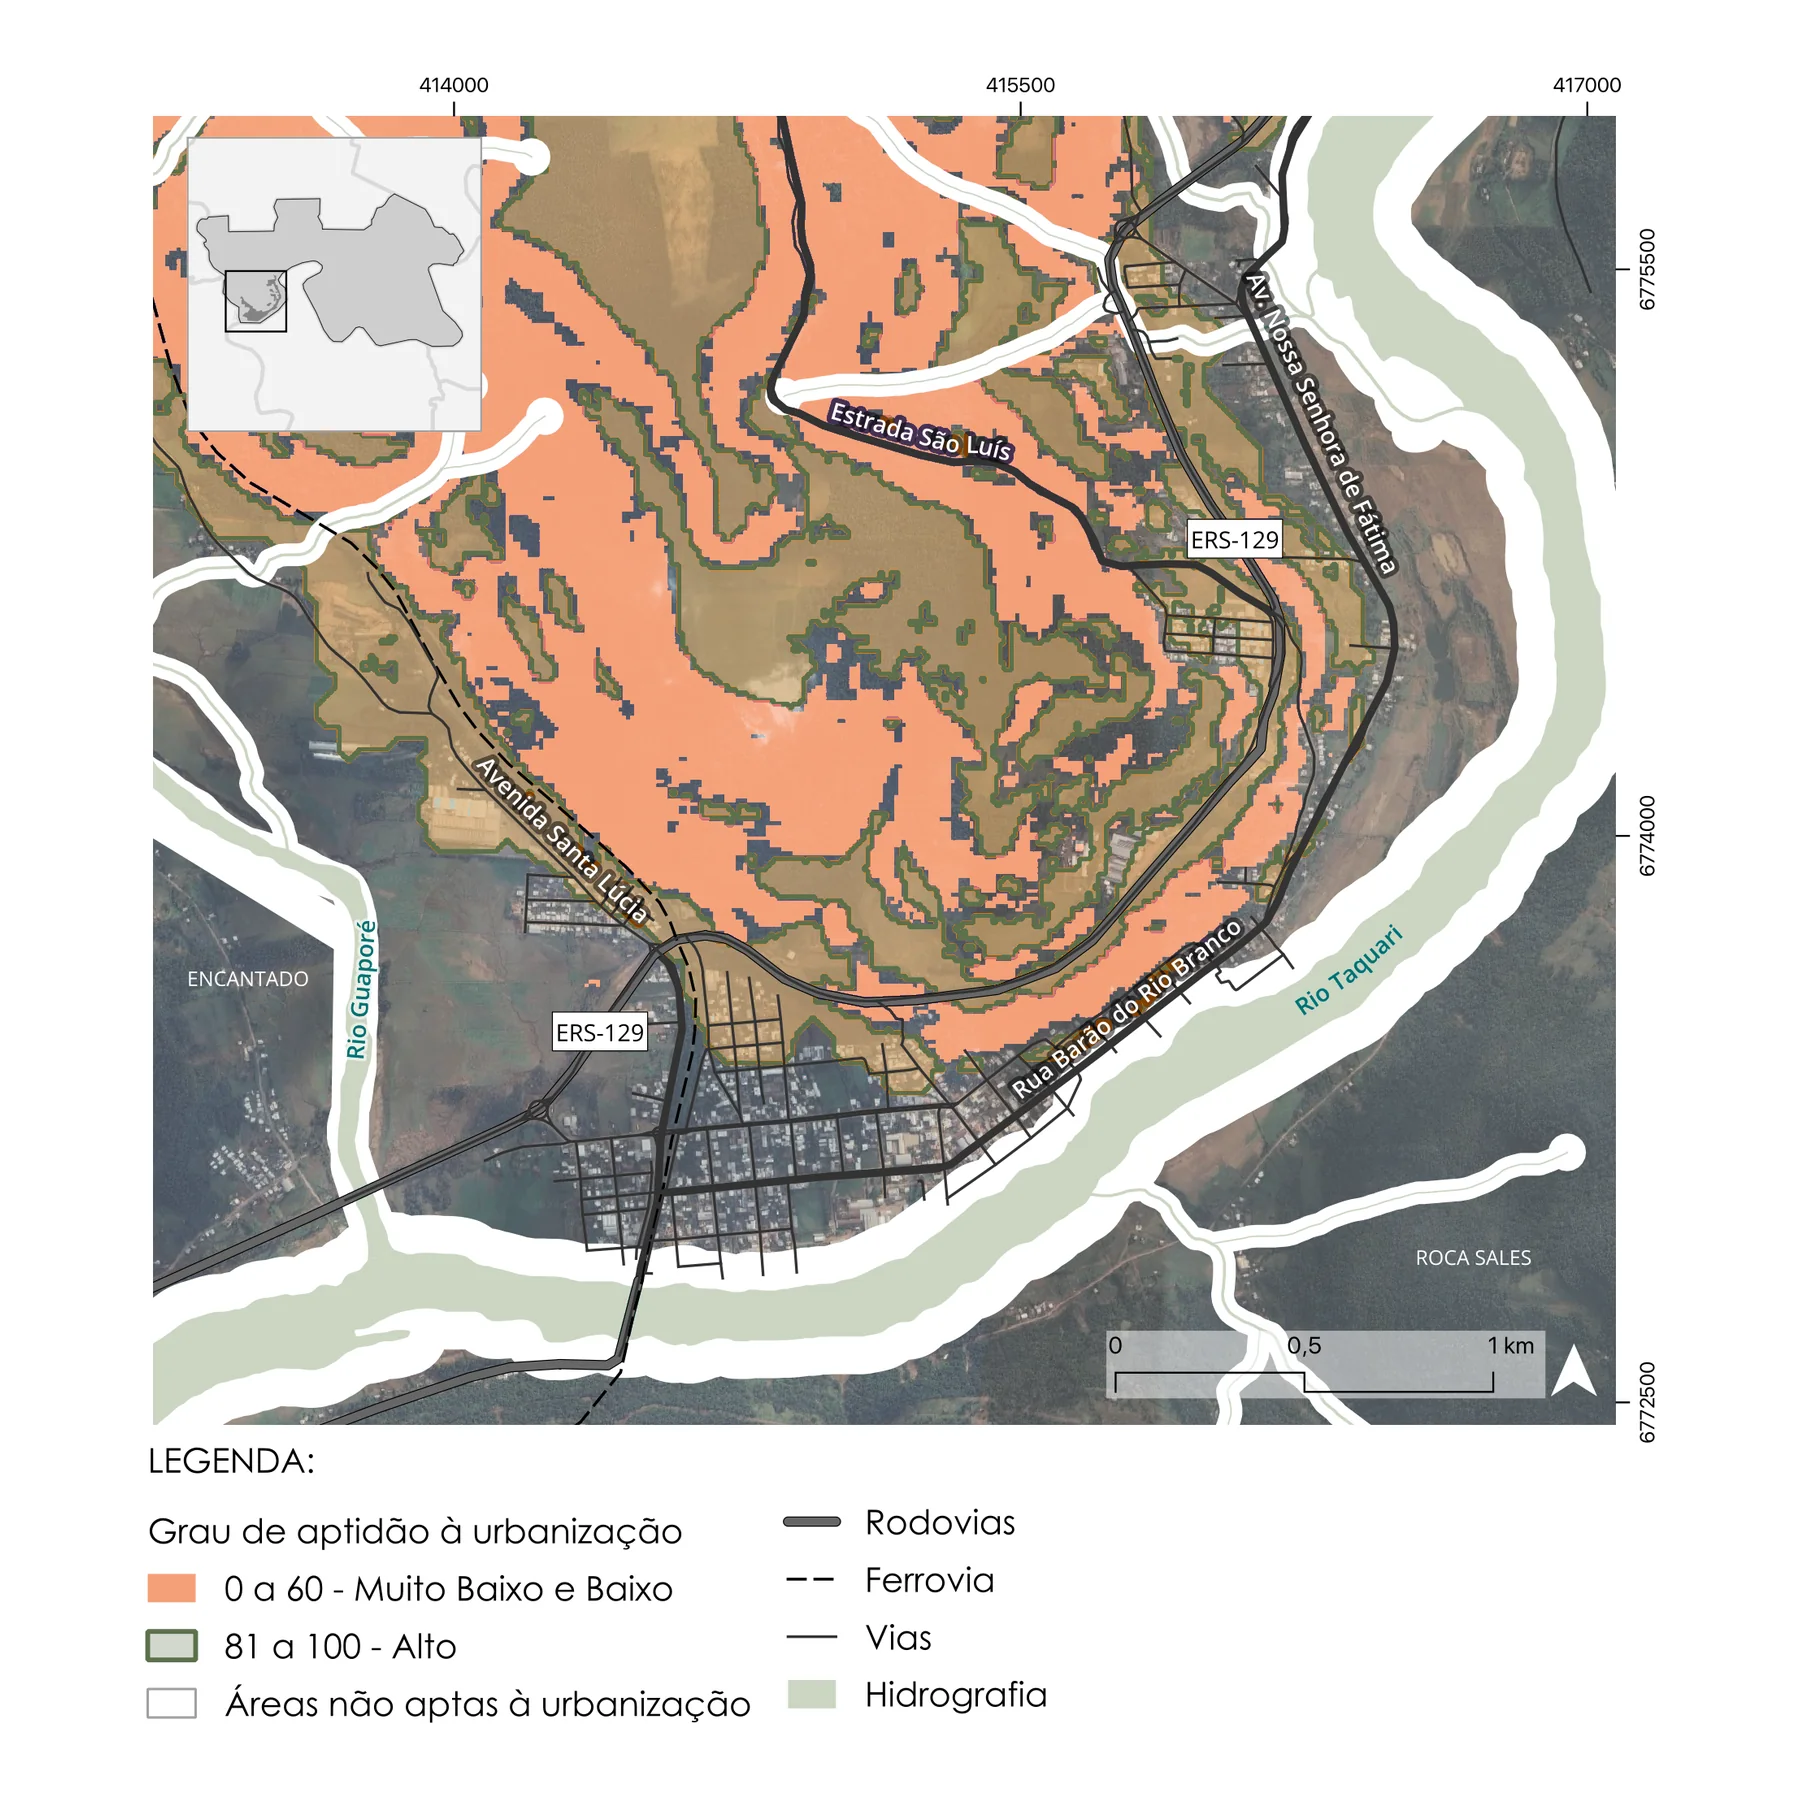
Overlay with ongoing projects, growth trends and input from municipal technicians → priority occupation areas
The weighting logic favors compact growth: land that is already urbanized or close to existing infrastructure scores higher, natural vegetation is protected, and slopes above 30% are excluded in line with the federal land subdivision law (Law 6.766/79).
Results#
- A suitability map for each of the seven municipalities, classifying land into four levels (very low, low, medium, high) plus areas not suitable for urbanization.
- Preliminary priority-occupation guidelines for housing, public facilities, commerce and services, discussed with each municipality’s support group.
- Recommendations for areas already consolidated in high and medium risk zones: contingency plans, continuous monitoring, drainage upgrades and community engagement.
Impact#
The study gave municipalities an emergency decision-support tool during reconstruction and a technical basis for their new master plans. All maps were published on the State’s spatial data infrastructure, so planners and the public can explore them interactively.
A peer-reviewed paper on the method is forthcoming.
Maps#
Reports#
Technical reports delivered to SEDUR, in Portuguese. Explore the interactive maps on the State’s spatial data portal.
1. Risk zoning — flood and landslide susceptibility, drag zones: Arroio do Meio · Colinas · Cruzeiro do Sul · Encantado · Estrela · Muçum · Roca Sales
2. Preliminary guidelines for priority occupation: Arroio do Meio · Colinas · Cruzeiro do Sul · Encantado · Estrela · Muçum · Roca Sales
3. Technical diagnosis — physical, social, economic, infrastructure, mobility and legislation: Arroio do Meio · Colinas · Cruzeiro do Sul · Encantado · Estrela · Muçum · Roca Sales