- Period
- 2021–2025
- Location
- Santa Cruz do Sul, Rio Grande do Sul, Brazil
- Partners
- PROPUR/UFRGS (PhD in Urban and Regional Planning)
- My role
- Independent doctoral research: research design, data collection and database, indicators and index, spatial analysis, interviews and writing.
- Data
- IBGE censuses · Municipal databases · MapBiomas · Google Open Buildings · OpenStreetMap · FEPAM/RS · DAER · Public policy documents · Semi-structured interviews
- Tools & methods
- Python · QGIS · PostgreSQL/PostGIS · Composite index · Mixed methods
The challenge#
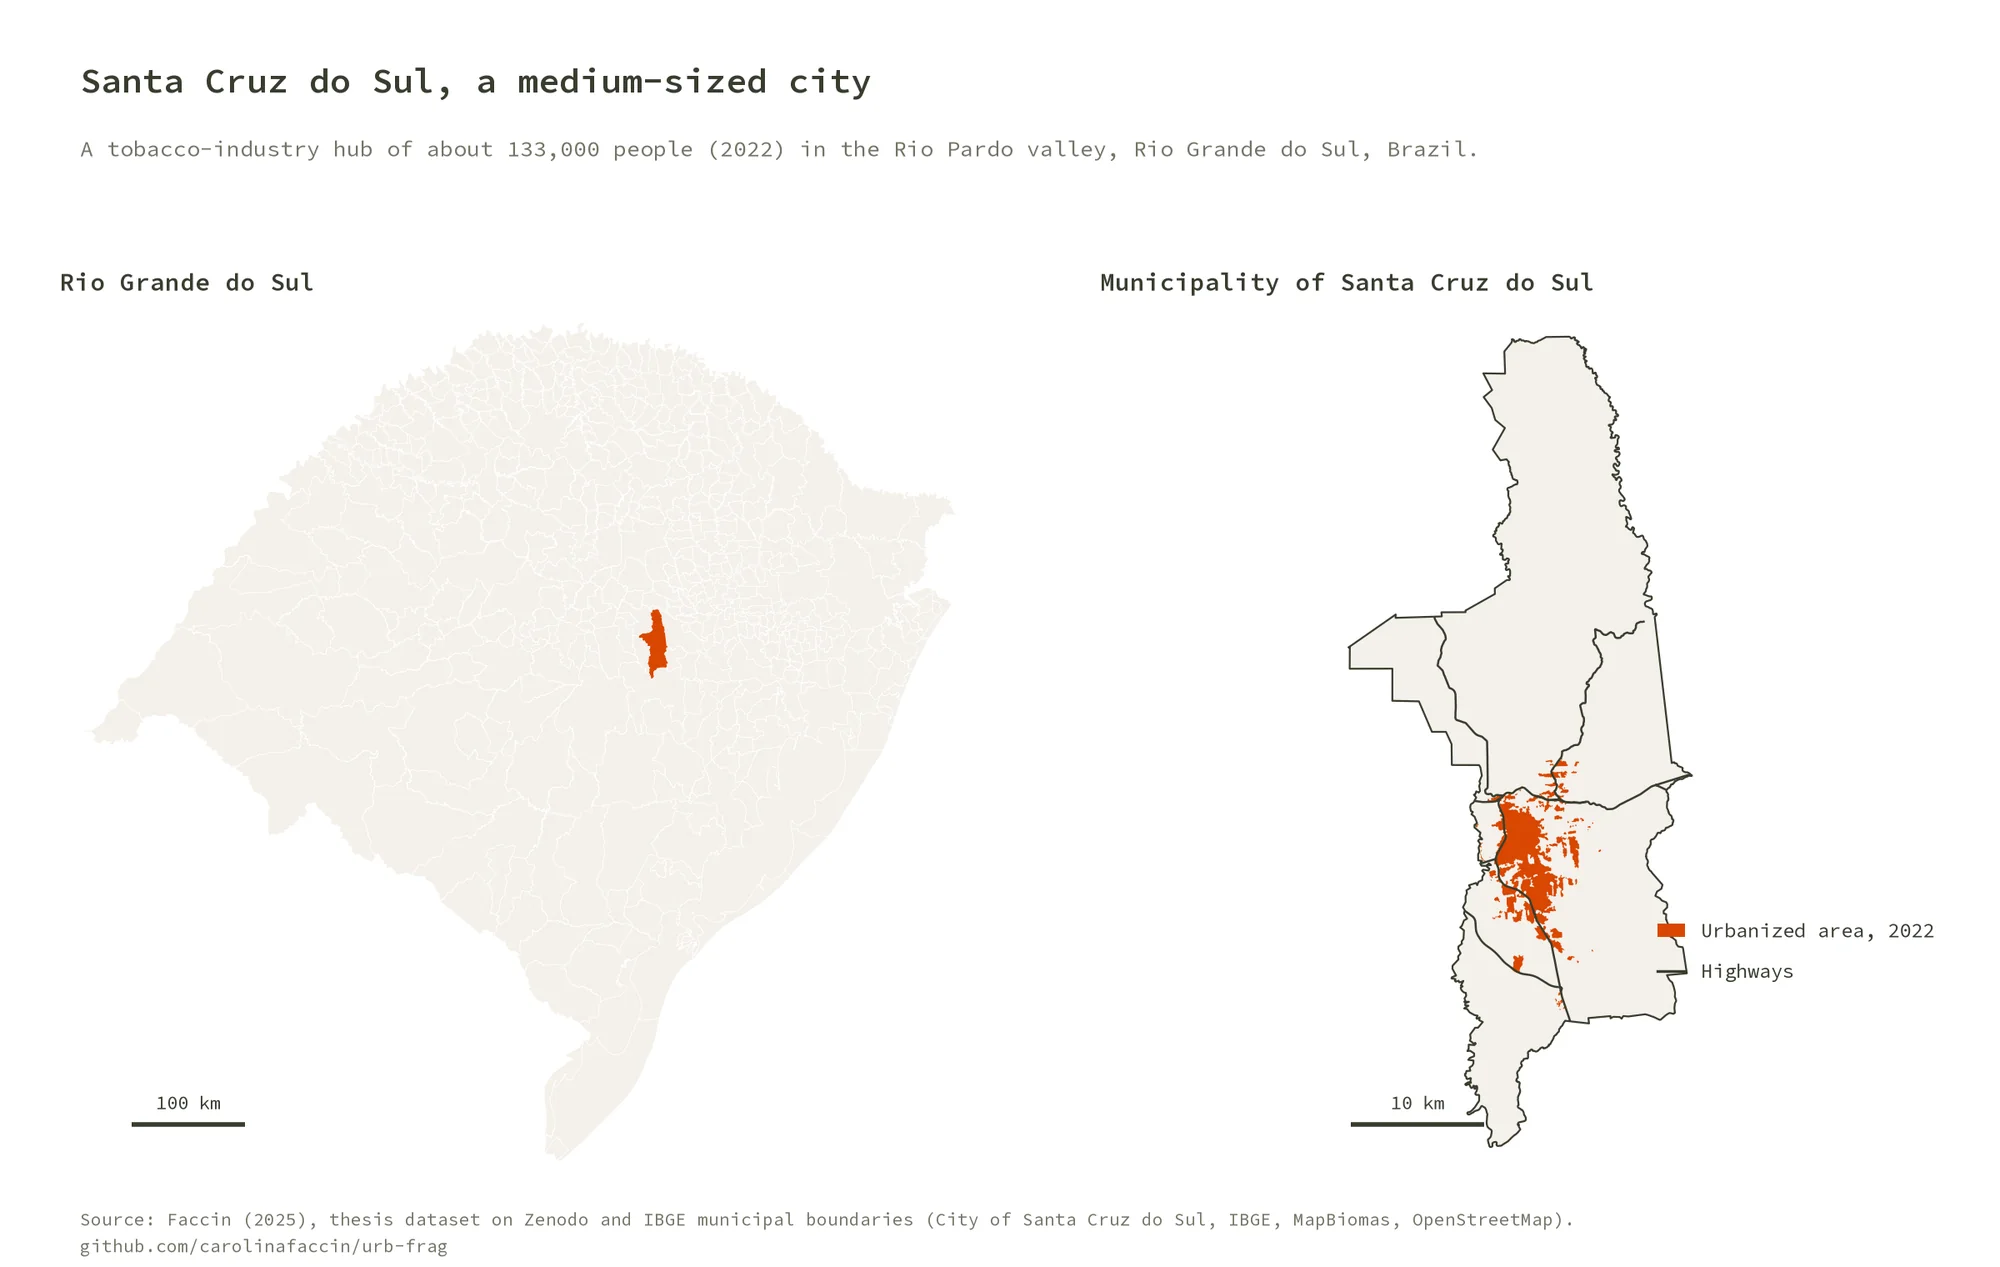
Segregation is usually studied in large metropolises. Medium-sized cities, which are growing fast in Brazil, often reproduce the same patterns with less scrutiny. Santa Cruz do Sul, a tobacco-industry hub of about 130,000 people, offered a chance to trace how a city became divided, from its agro-industrial boom to today.
Approach#
The research combined a historical reading of the city with a quantitative spatial model. I identified three phases of urban development, built a database of indicators and synthesized them into a single fragmentation index.
- Periodization
Documents and interviews define three phases: 1970–1993, 1993–2013, 2013–2022
- Indicators
Four families: environmental, social, housing and infrastructure
- Synthesis
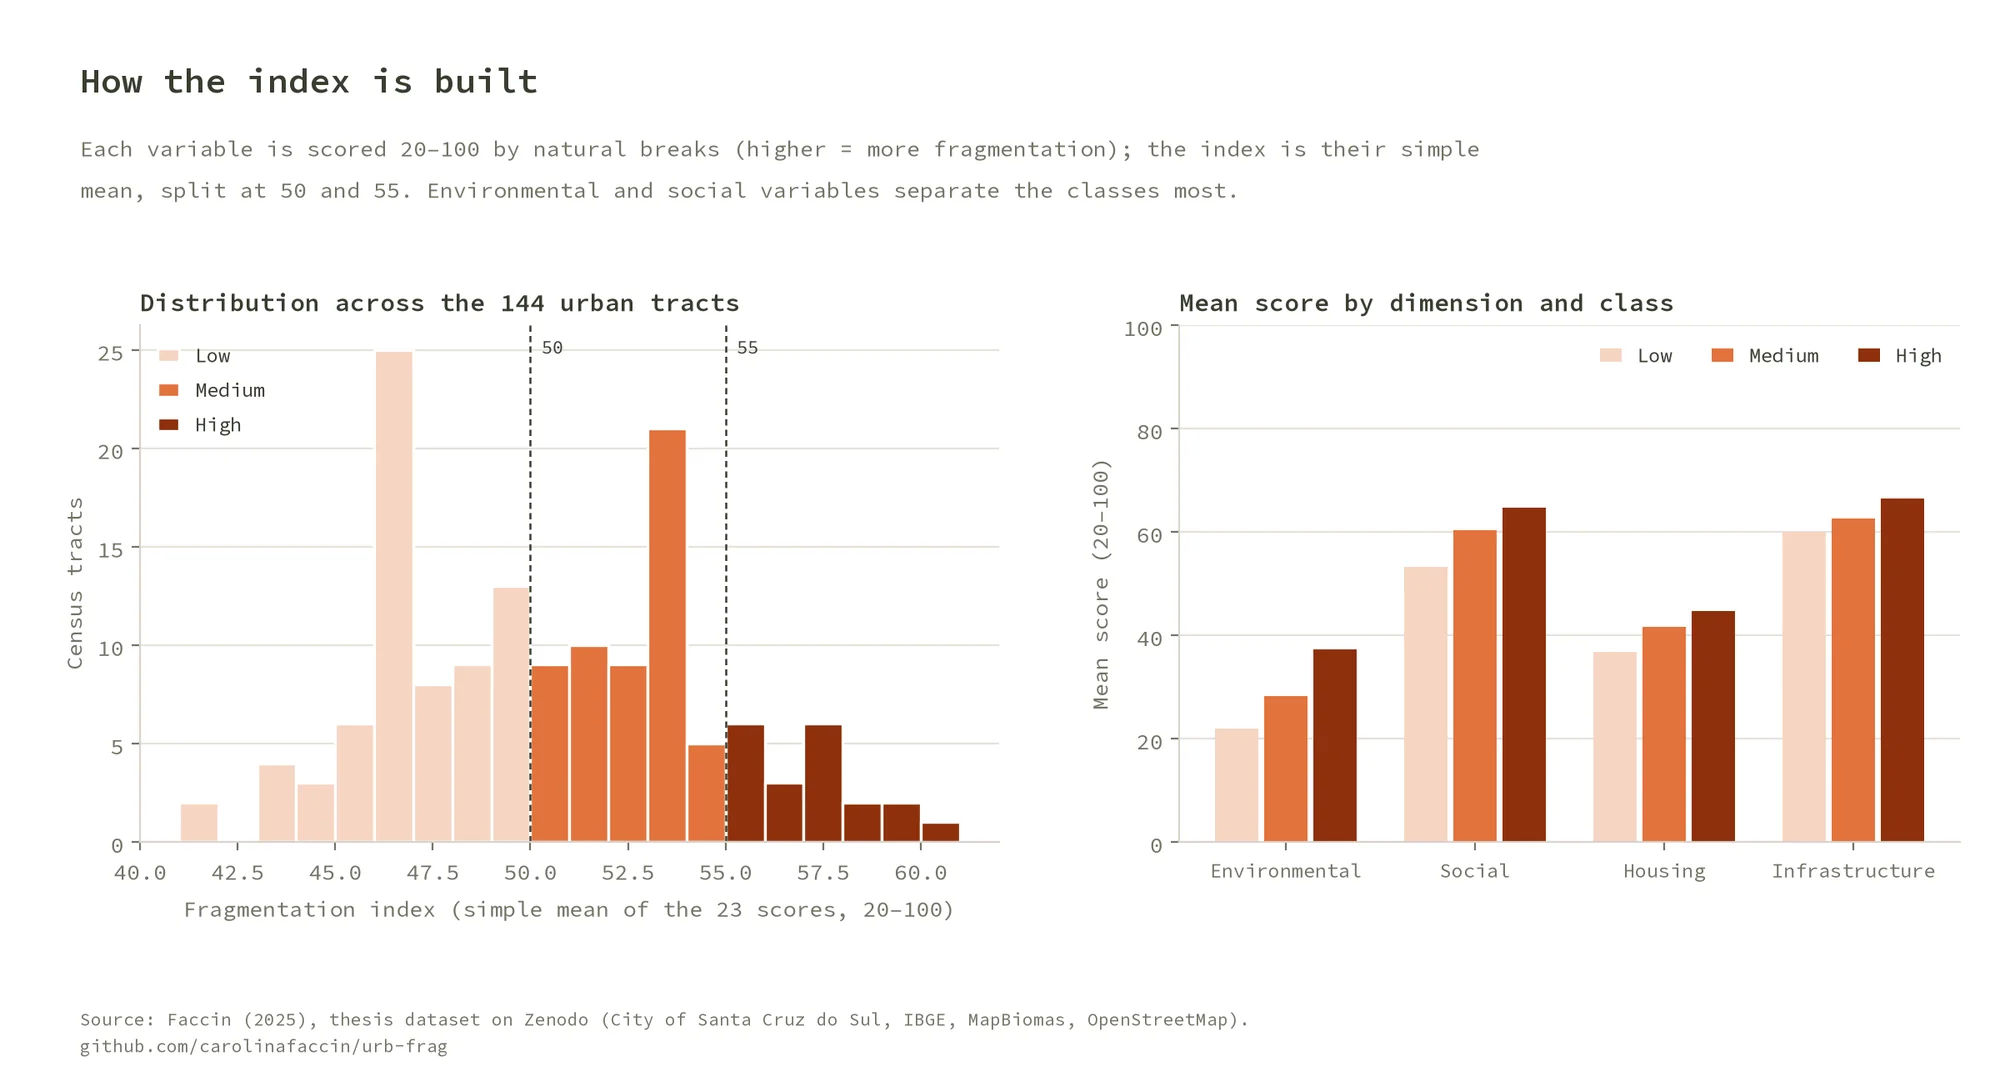
Quantitative spatial synthesis into a fragmentation index (high, medium, low)
- Interpretation
Barriers, gated communities and social housing read together with policies and market
Results#
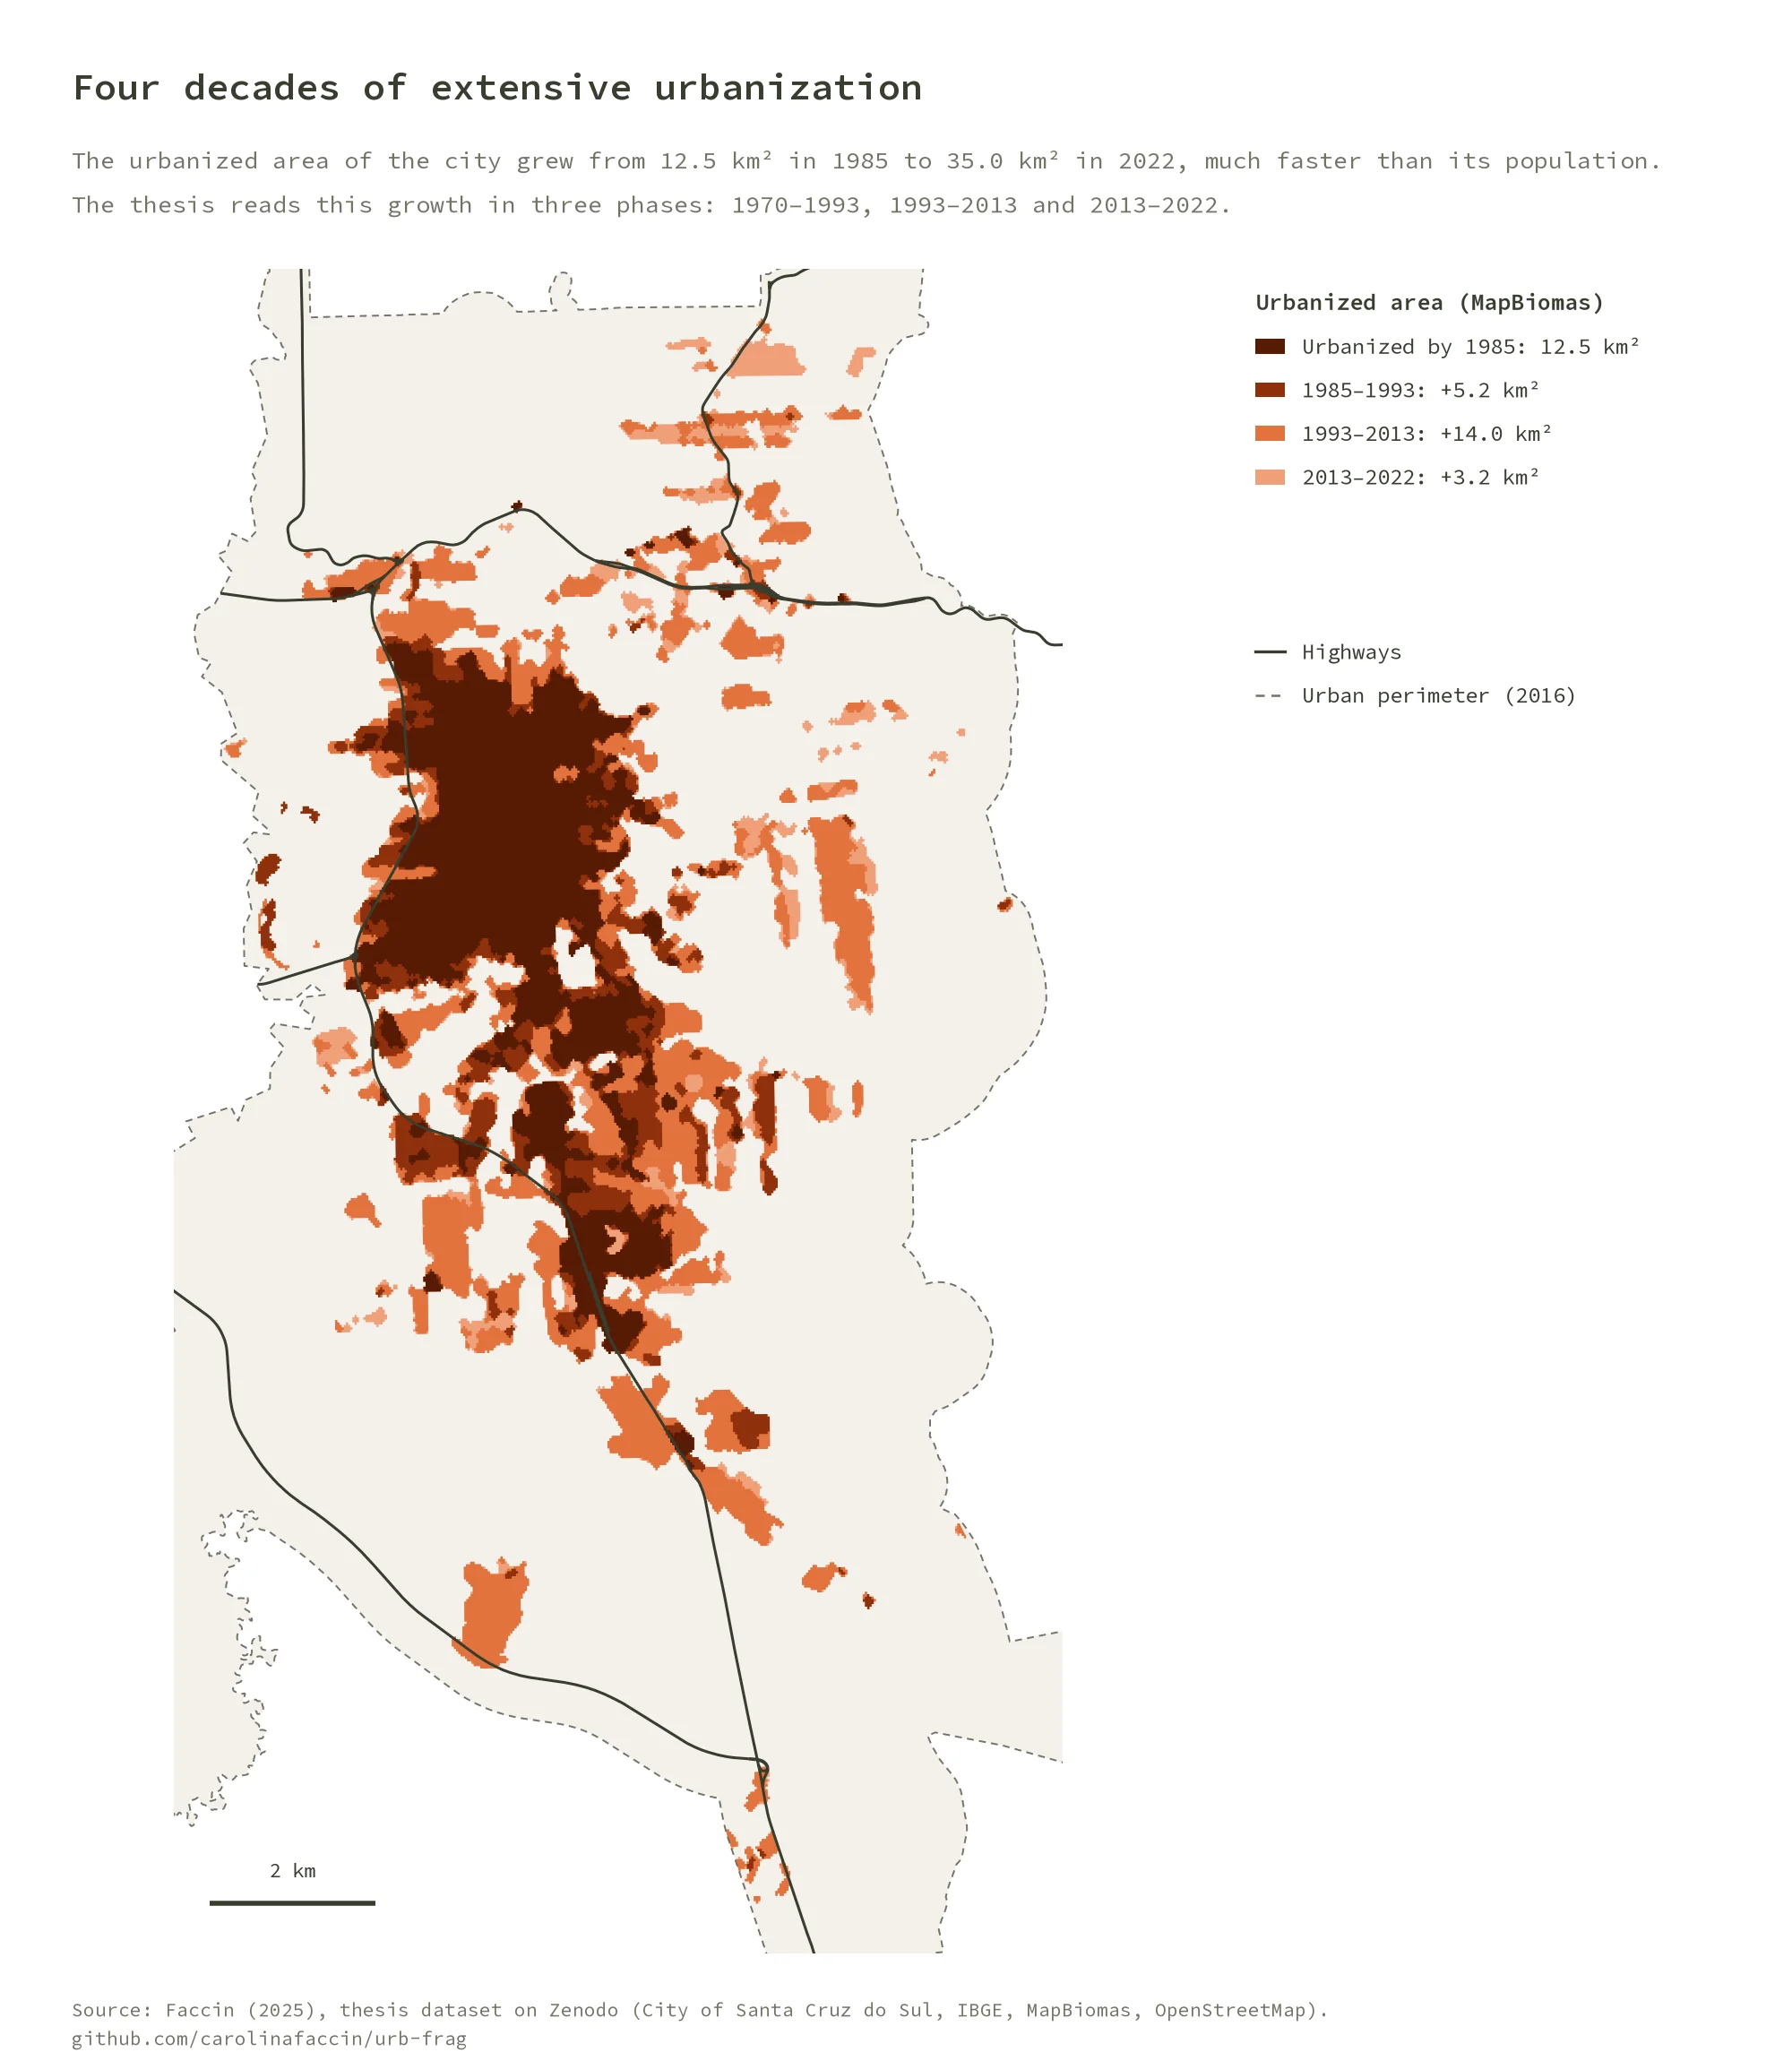
- Three phases of fragmentation: agro-industrial rise and migration (1970–1993), economic diversification and segregation (1993–2013), and consolidation of fragmentation (2013–2022).
- Physical and symbolic barriers (highways, industrial zones, natural features) that deepen inequality and limit urban integration.
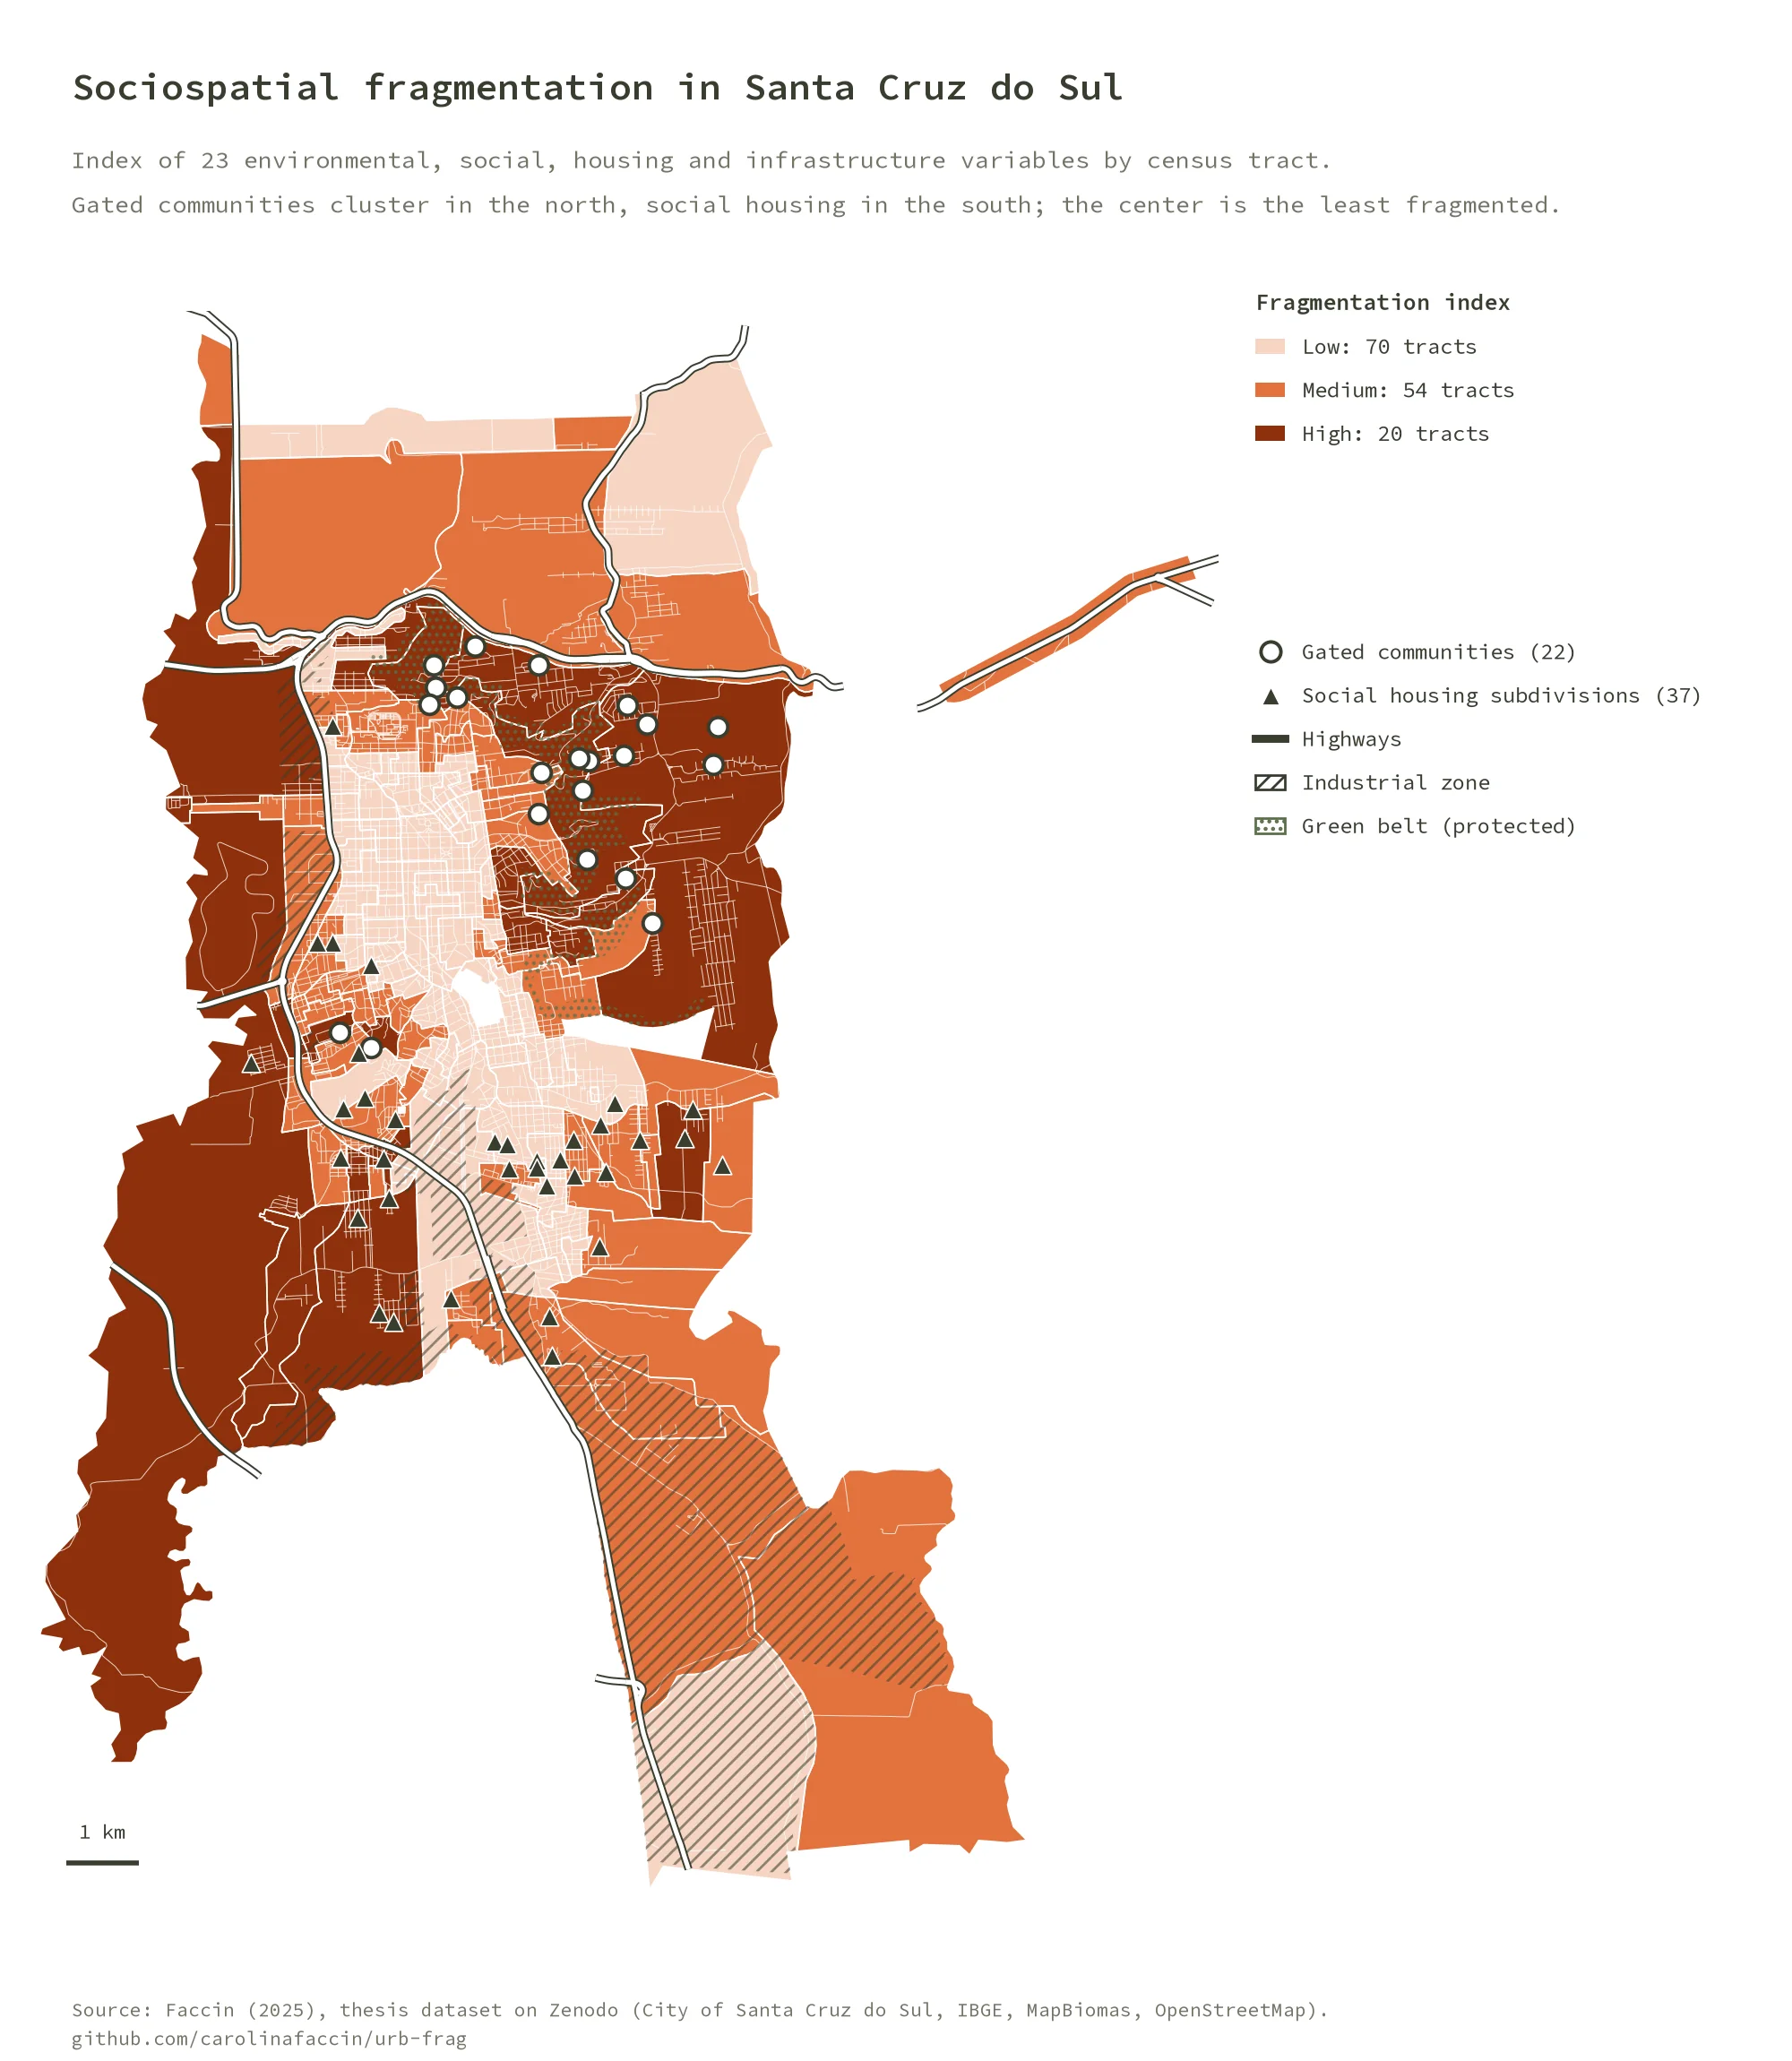
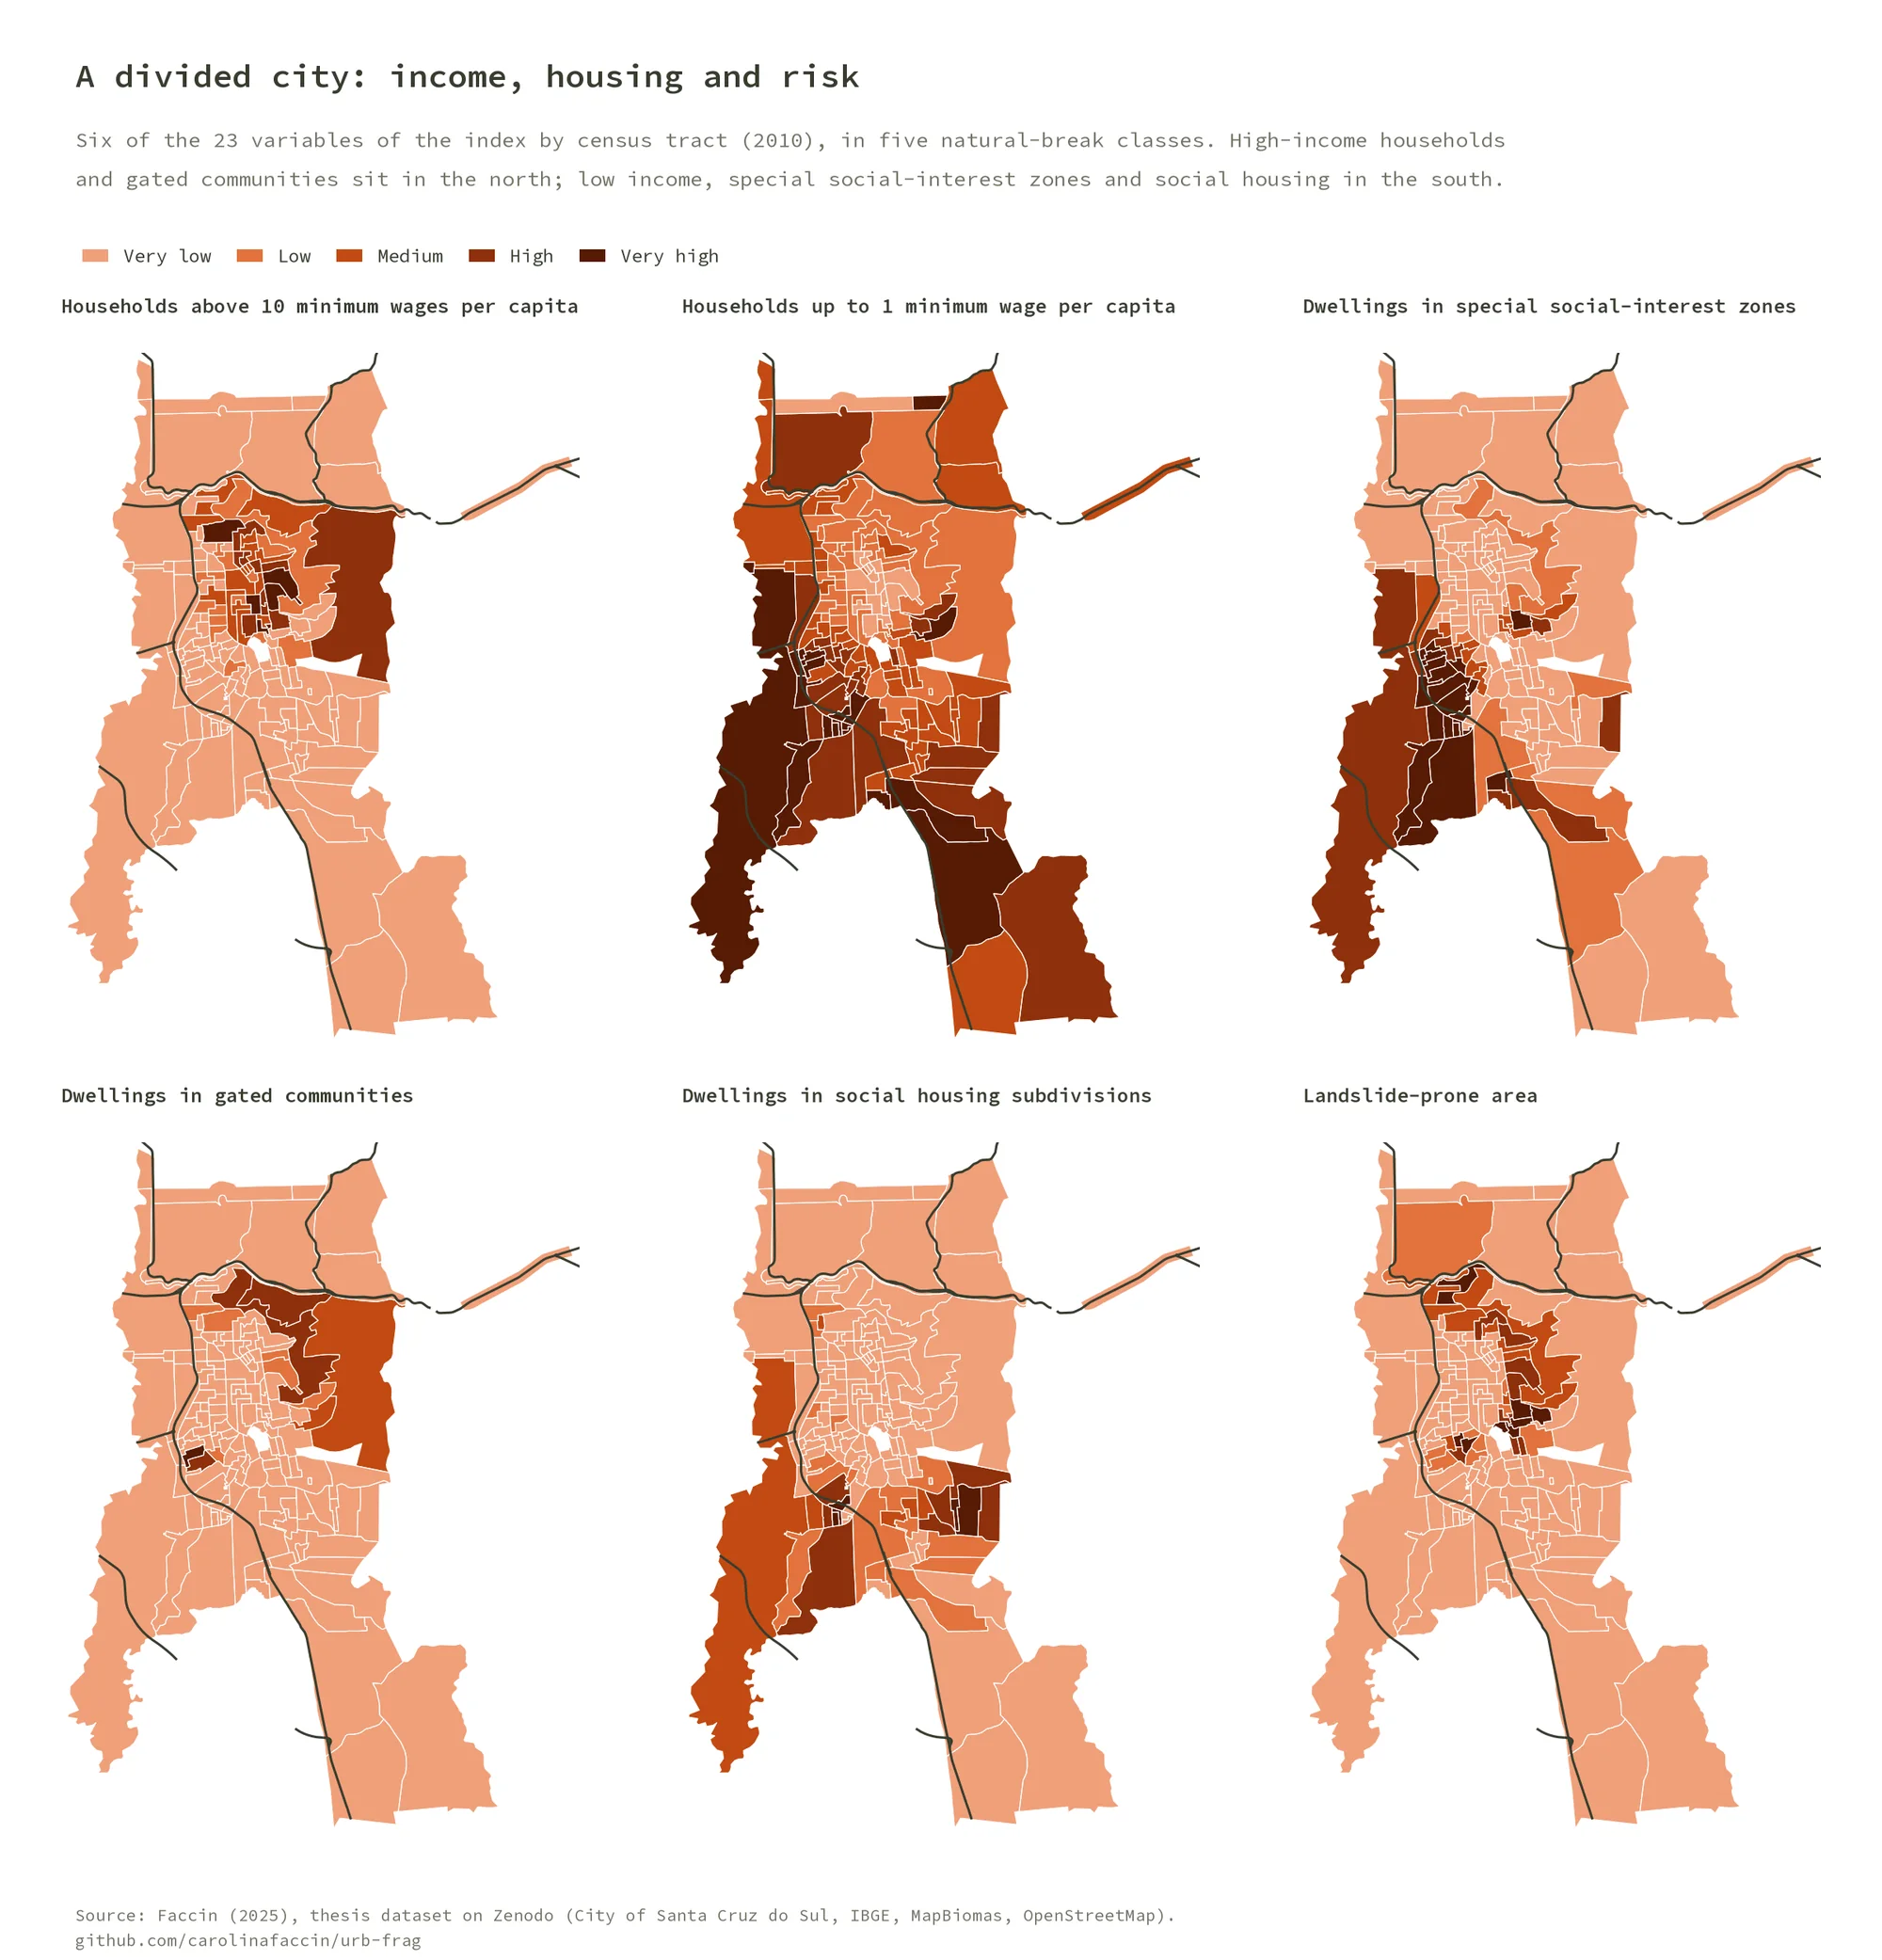
- A sharp north–south divide: the north concentrates gated communities and high-quality infrastructure for high-income residents; the south concentrates low-income housing developments with precarious public services.
- The index splits the 144 urban census tracts into 70 of low, 54 of medium and 20 of high fragmentation: the center is the most integrated; the gated communities of the north and the social housing of the south and west are the most fragmented.
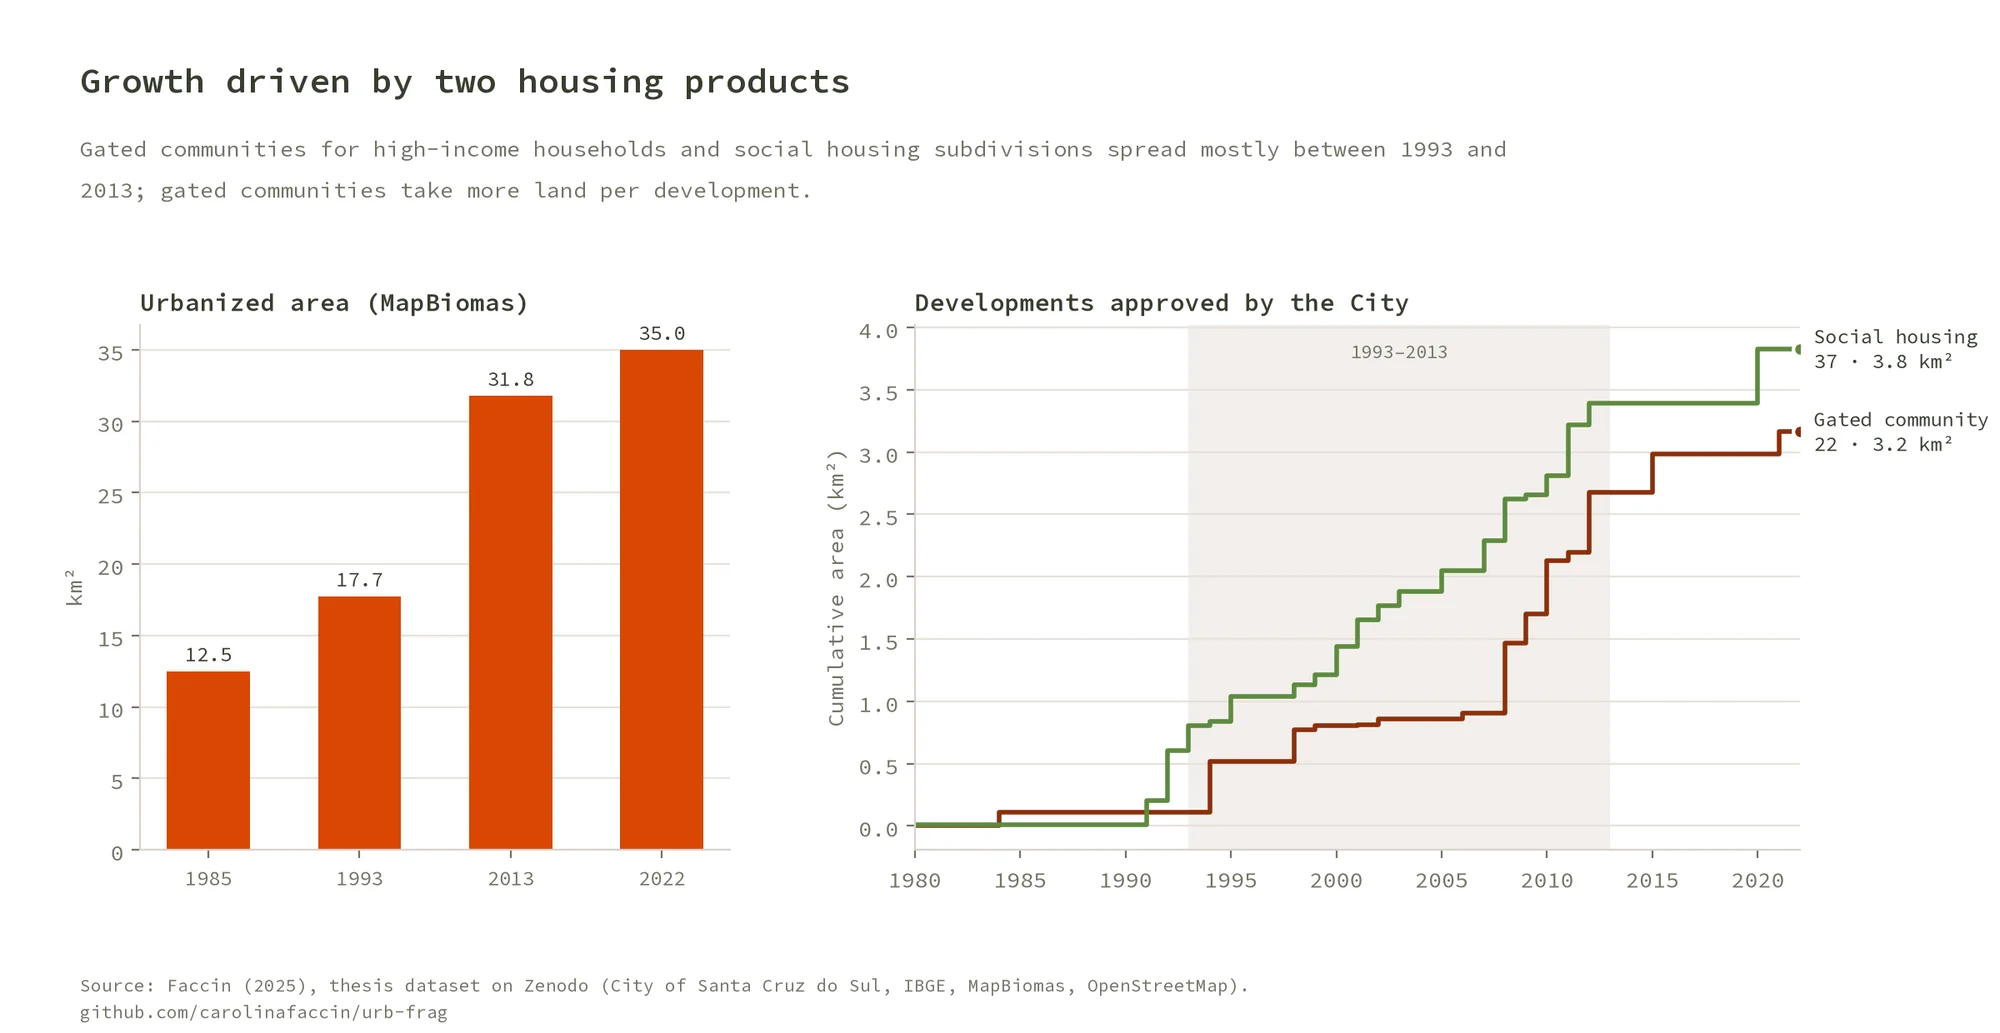
- The city urbanized fast and extensively: from 12.5 km² in 1985 to 35 km² in 2022 (MapBiomas), with 22 gated communities and 37 social housing subdivisions approved by the City, most of them between 1993 and 2013.
- Segregation persisted for five decades, reinforced by public policies and real estate dynamics, reproducing in a medium-sized city the exclusion typical of metropolises.
Why it matters#
The index and the database offer a diagnosis that can be updated and reused to inform zoning, housing policy and infrastructure investment, and the method can be transferred to other medium-sized cities.
- Thesis (PT)
- Open dataset on Zenodo
- Faccin (2025) (PT): paper presented at XXI ENANPUR.
I later rebuilt the index and the figures as an open, reproducible Python pipeline from the thesis dataset, checked against the numbers in the thesis: code and figures on GitHub.
Figures#
Produced by the open pipeline above.