- Period
- 2021–2024
- Location
- Porto Alegre, Rio Grande do Sul, Brazil
- Partners
- PROPUR/UFRGS; Observatório das Metrópoles (Porto Alegre core)
- My role
- Lead author: data collection and georeferencing, typology design, spatial and statistical analysis, maps and open dataset.
- Data
- Google Earth imagery (2022) · IBGE Census 2010 (income by census tract) · City of Porto Alegre (federal housing program sites) · OpenStreetMap
- Tools & methods
- QGIS · Python · Typology building · Spatial statistics
The challenge#
Gated communities have become a dominant housing product in Brazilian cities, but there was no consistent, city-wide map of them in Porto Alegre, let alone one that distinguished a high-rise tower complex from a cluster of townhouses or a social housing condominium. Without that, it is hard to discuss how housing markets and public programs shape the city.
Approach#
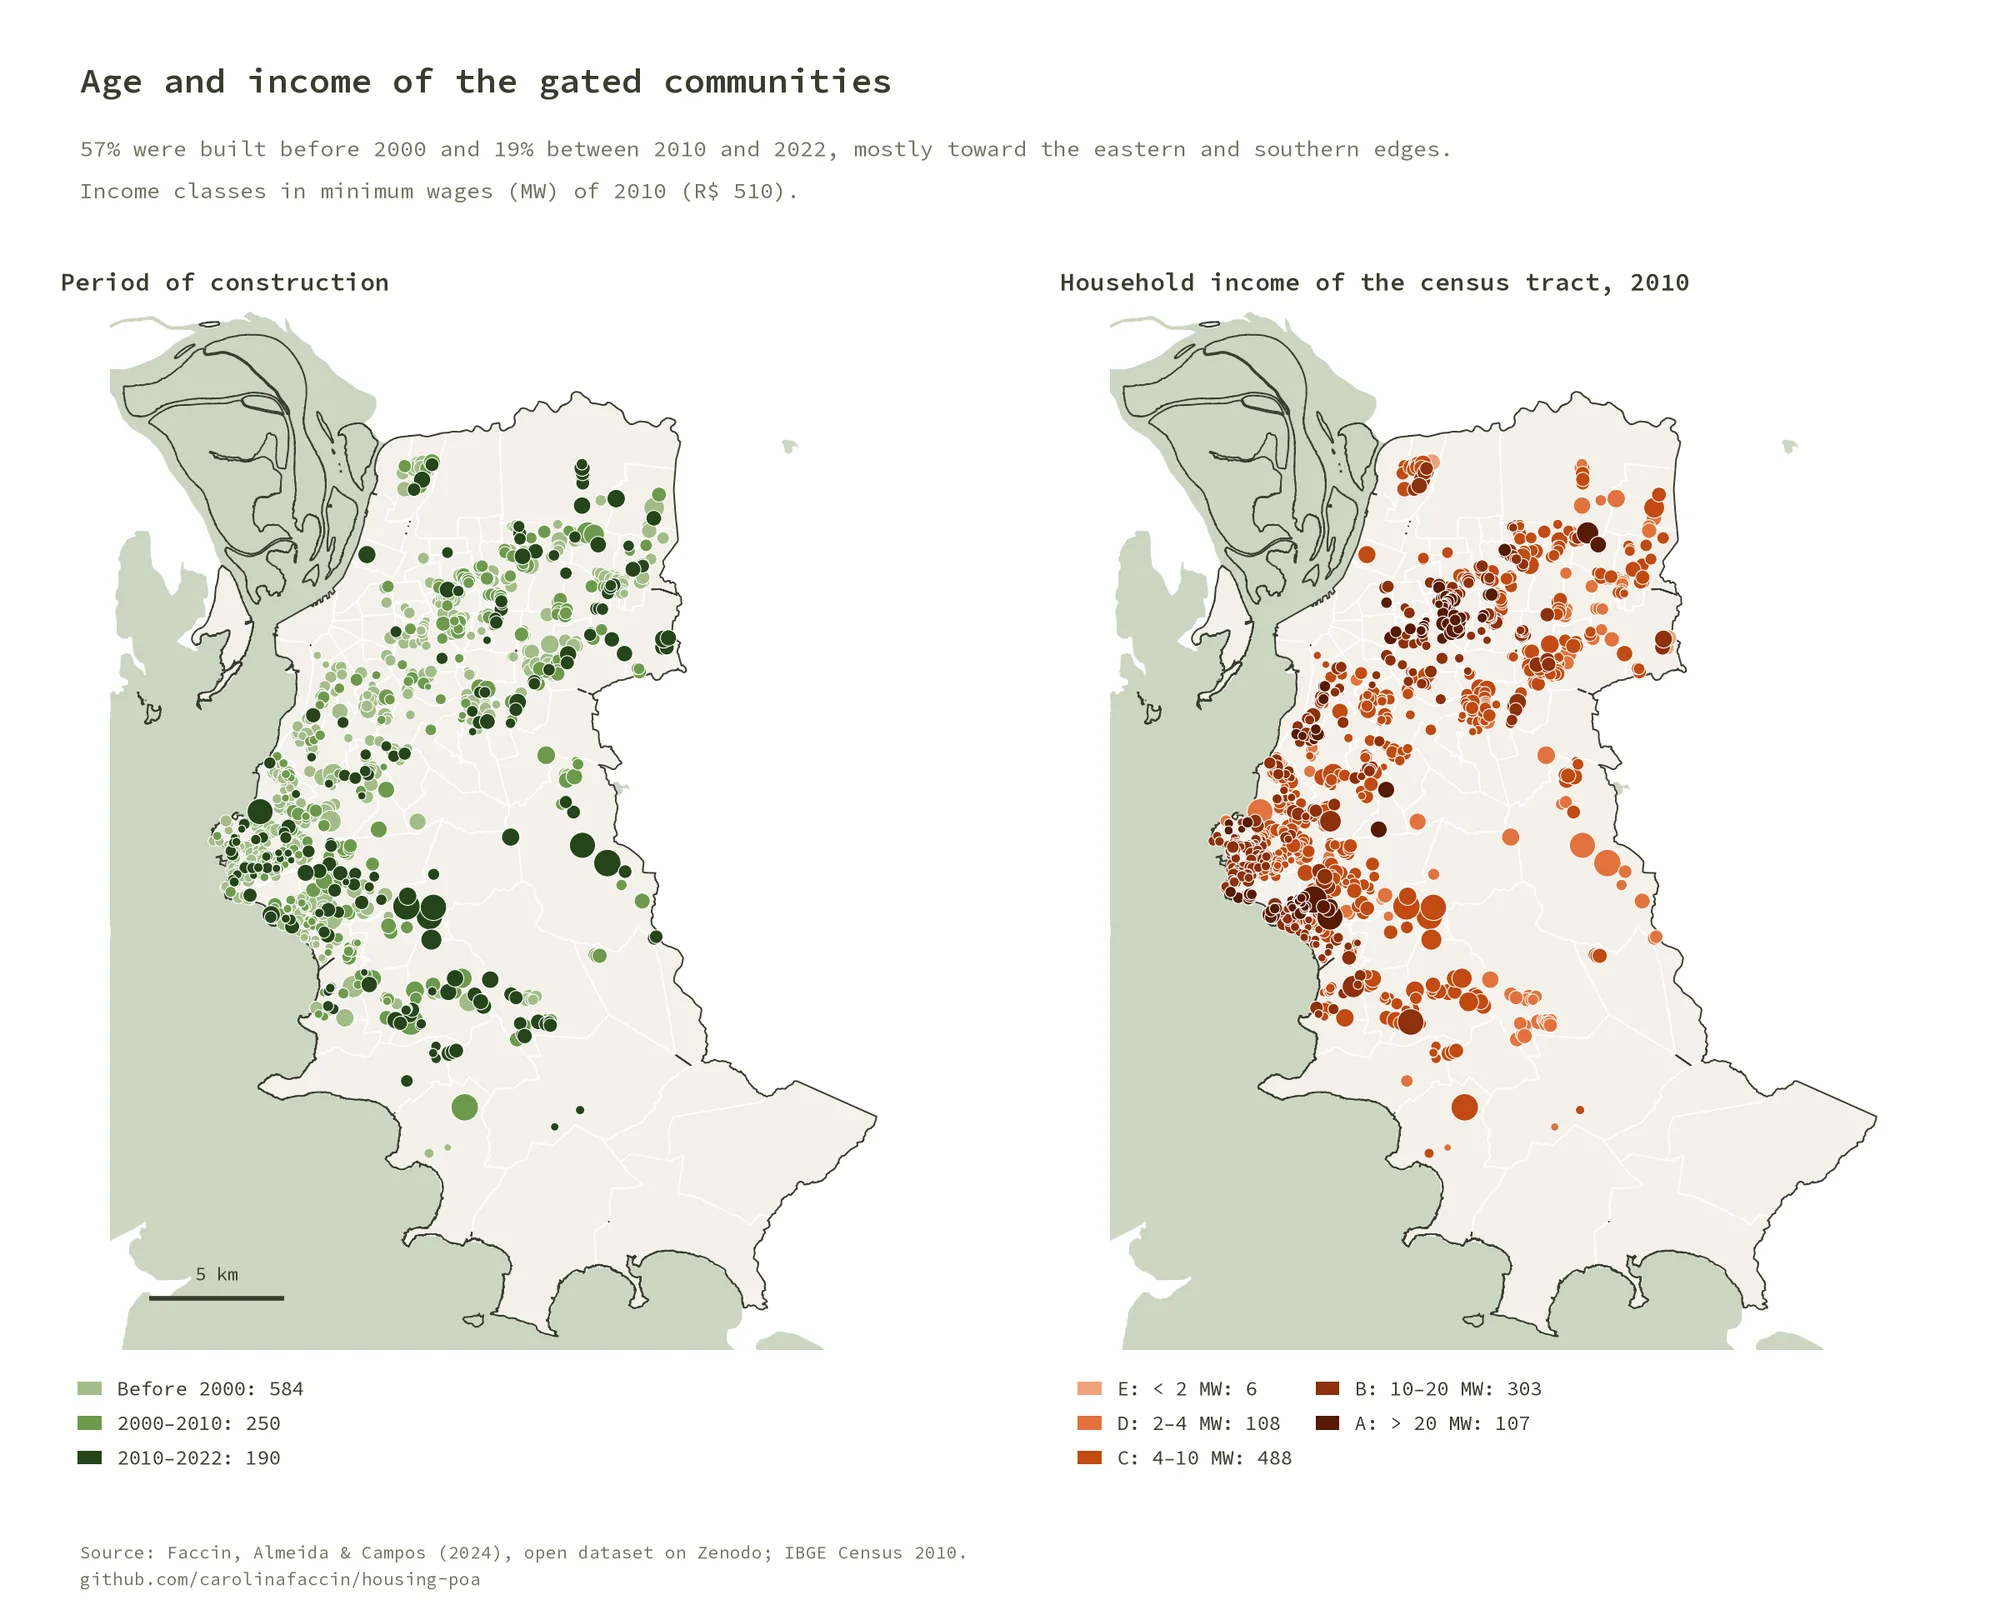
I built the dataset from scratch, georeferencing every gated community visible in satellite imagery and recording its built form and period of construction. Communities were then grouped into a typology and analyzed against neighborhood income.
- Mapping
Digitize every gated community from satellite imagery (2022)
- Attributes
Horizontal vs. vertical, number of floors, period of construction
- Typology
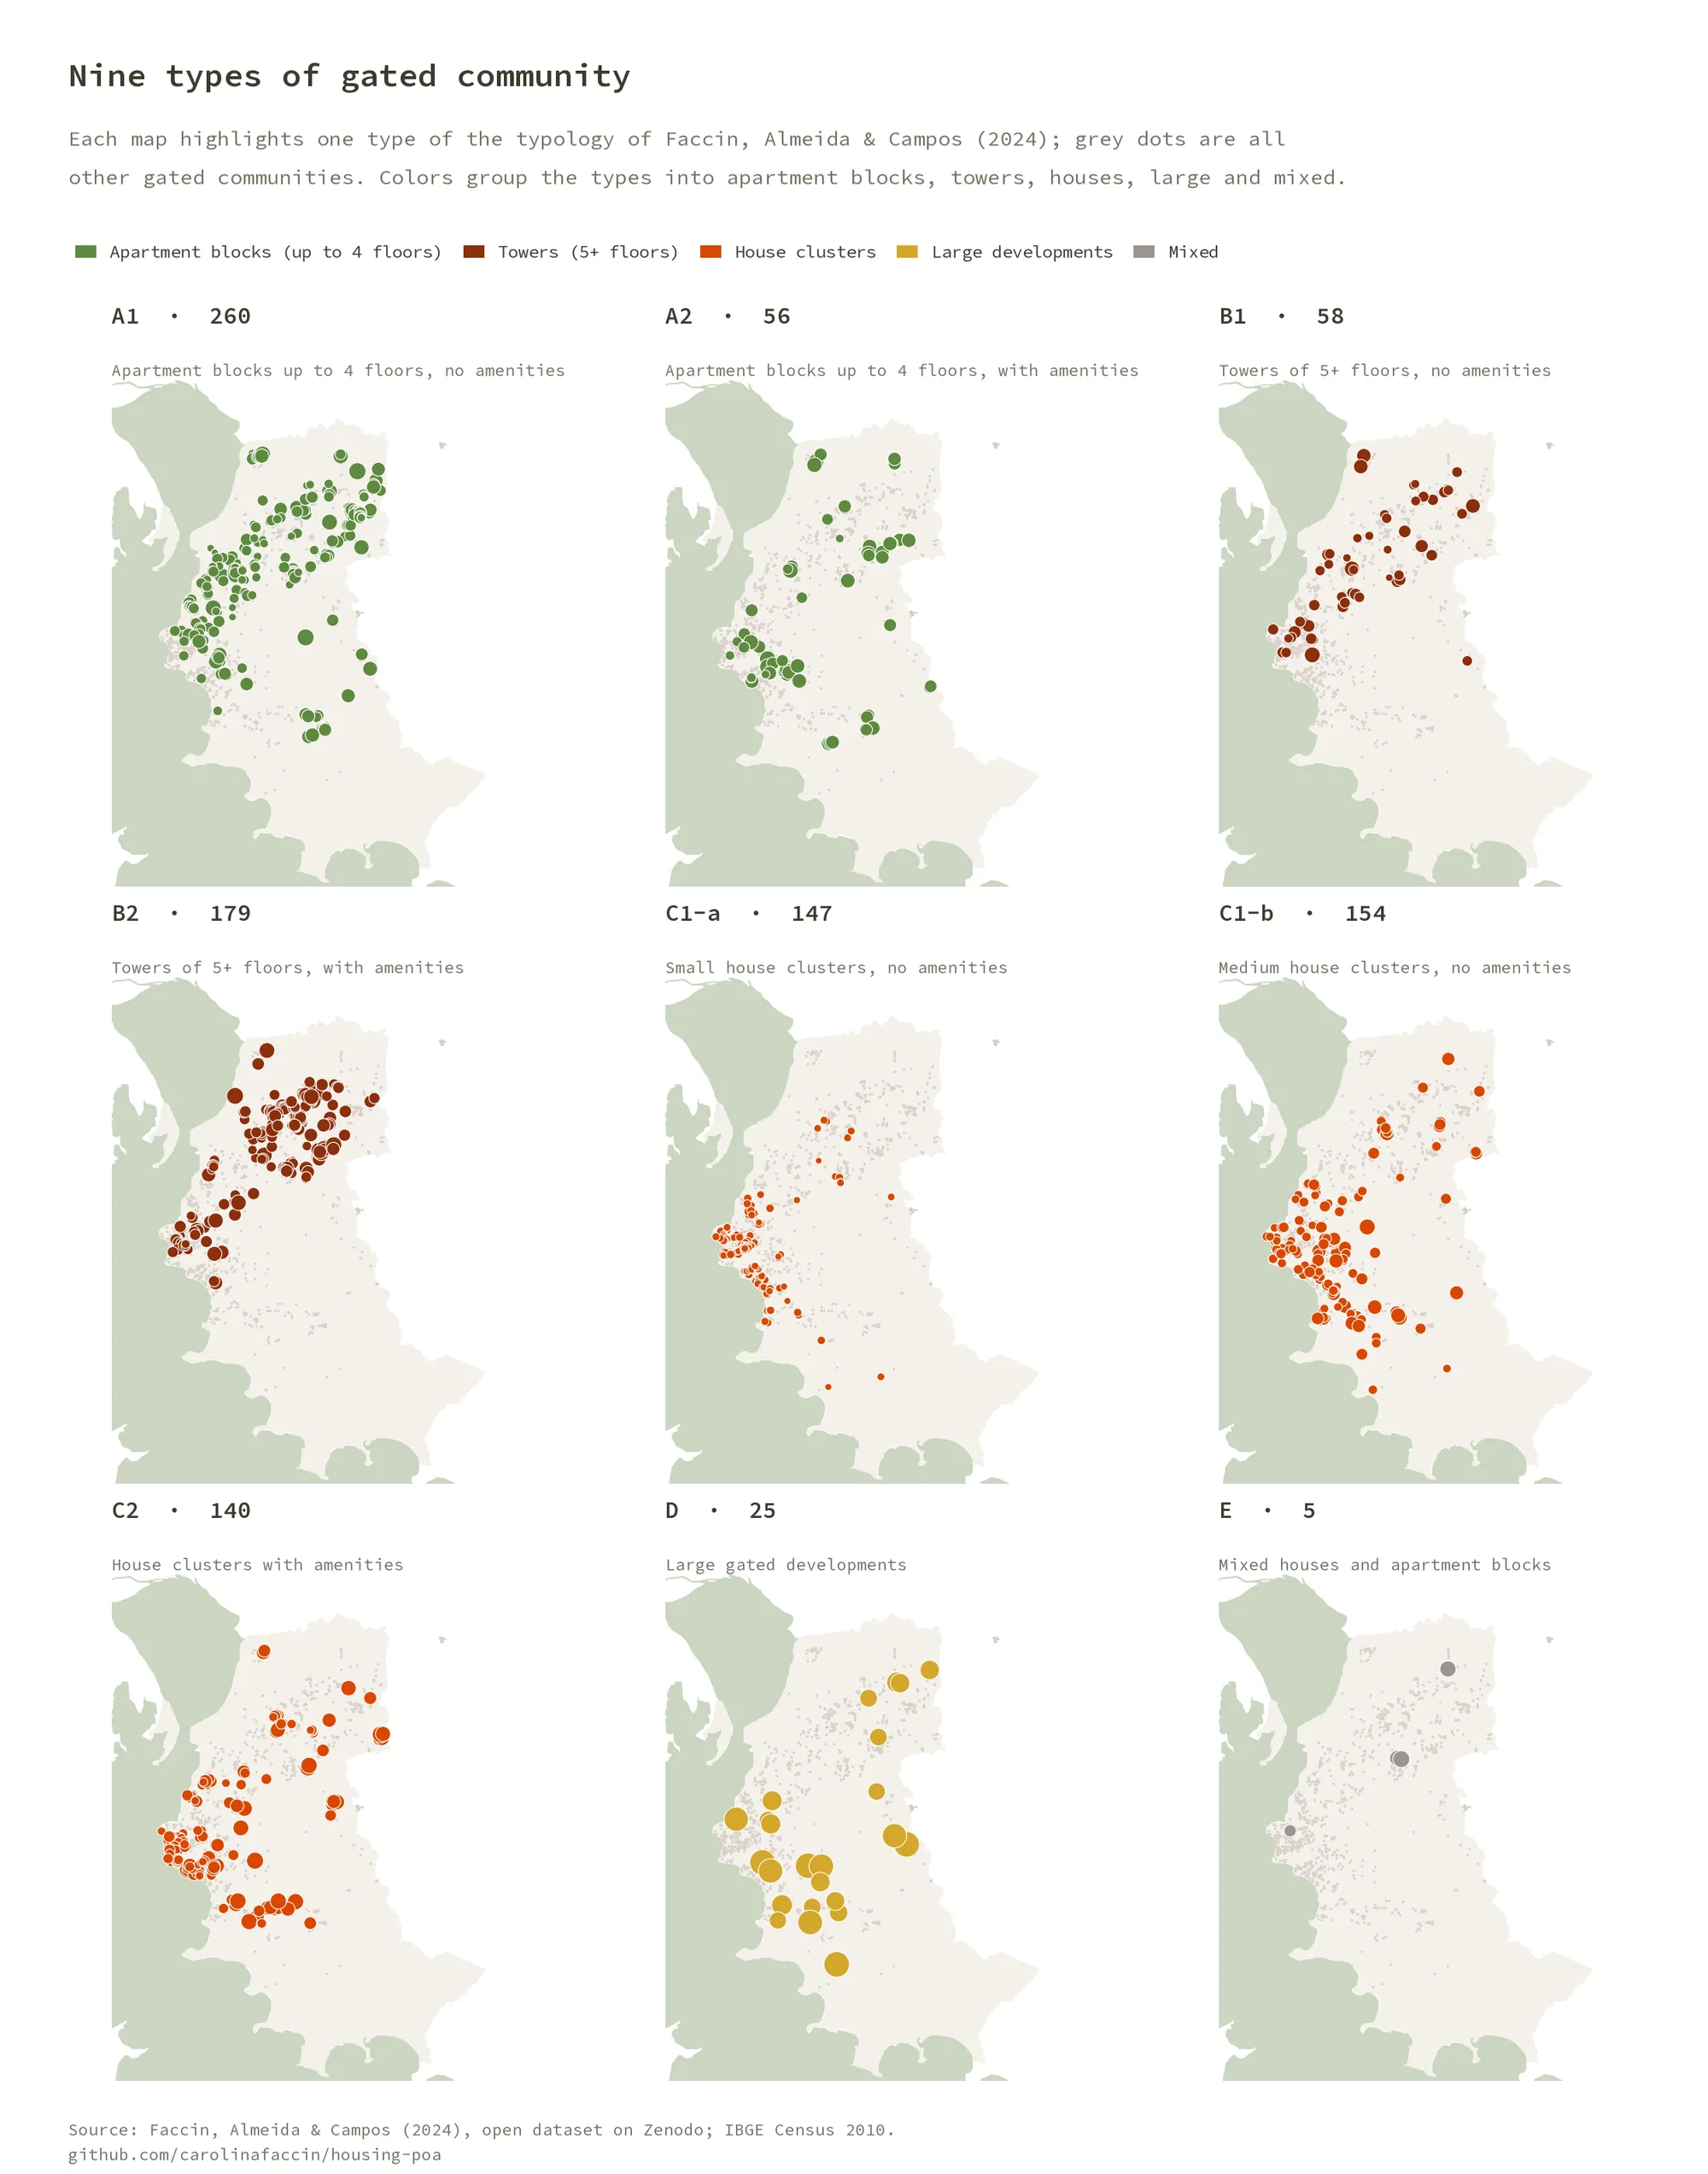
Nine built-form types (A1 to E)
- Analysis
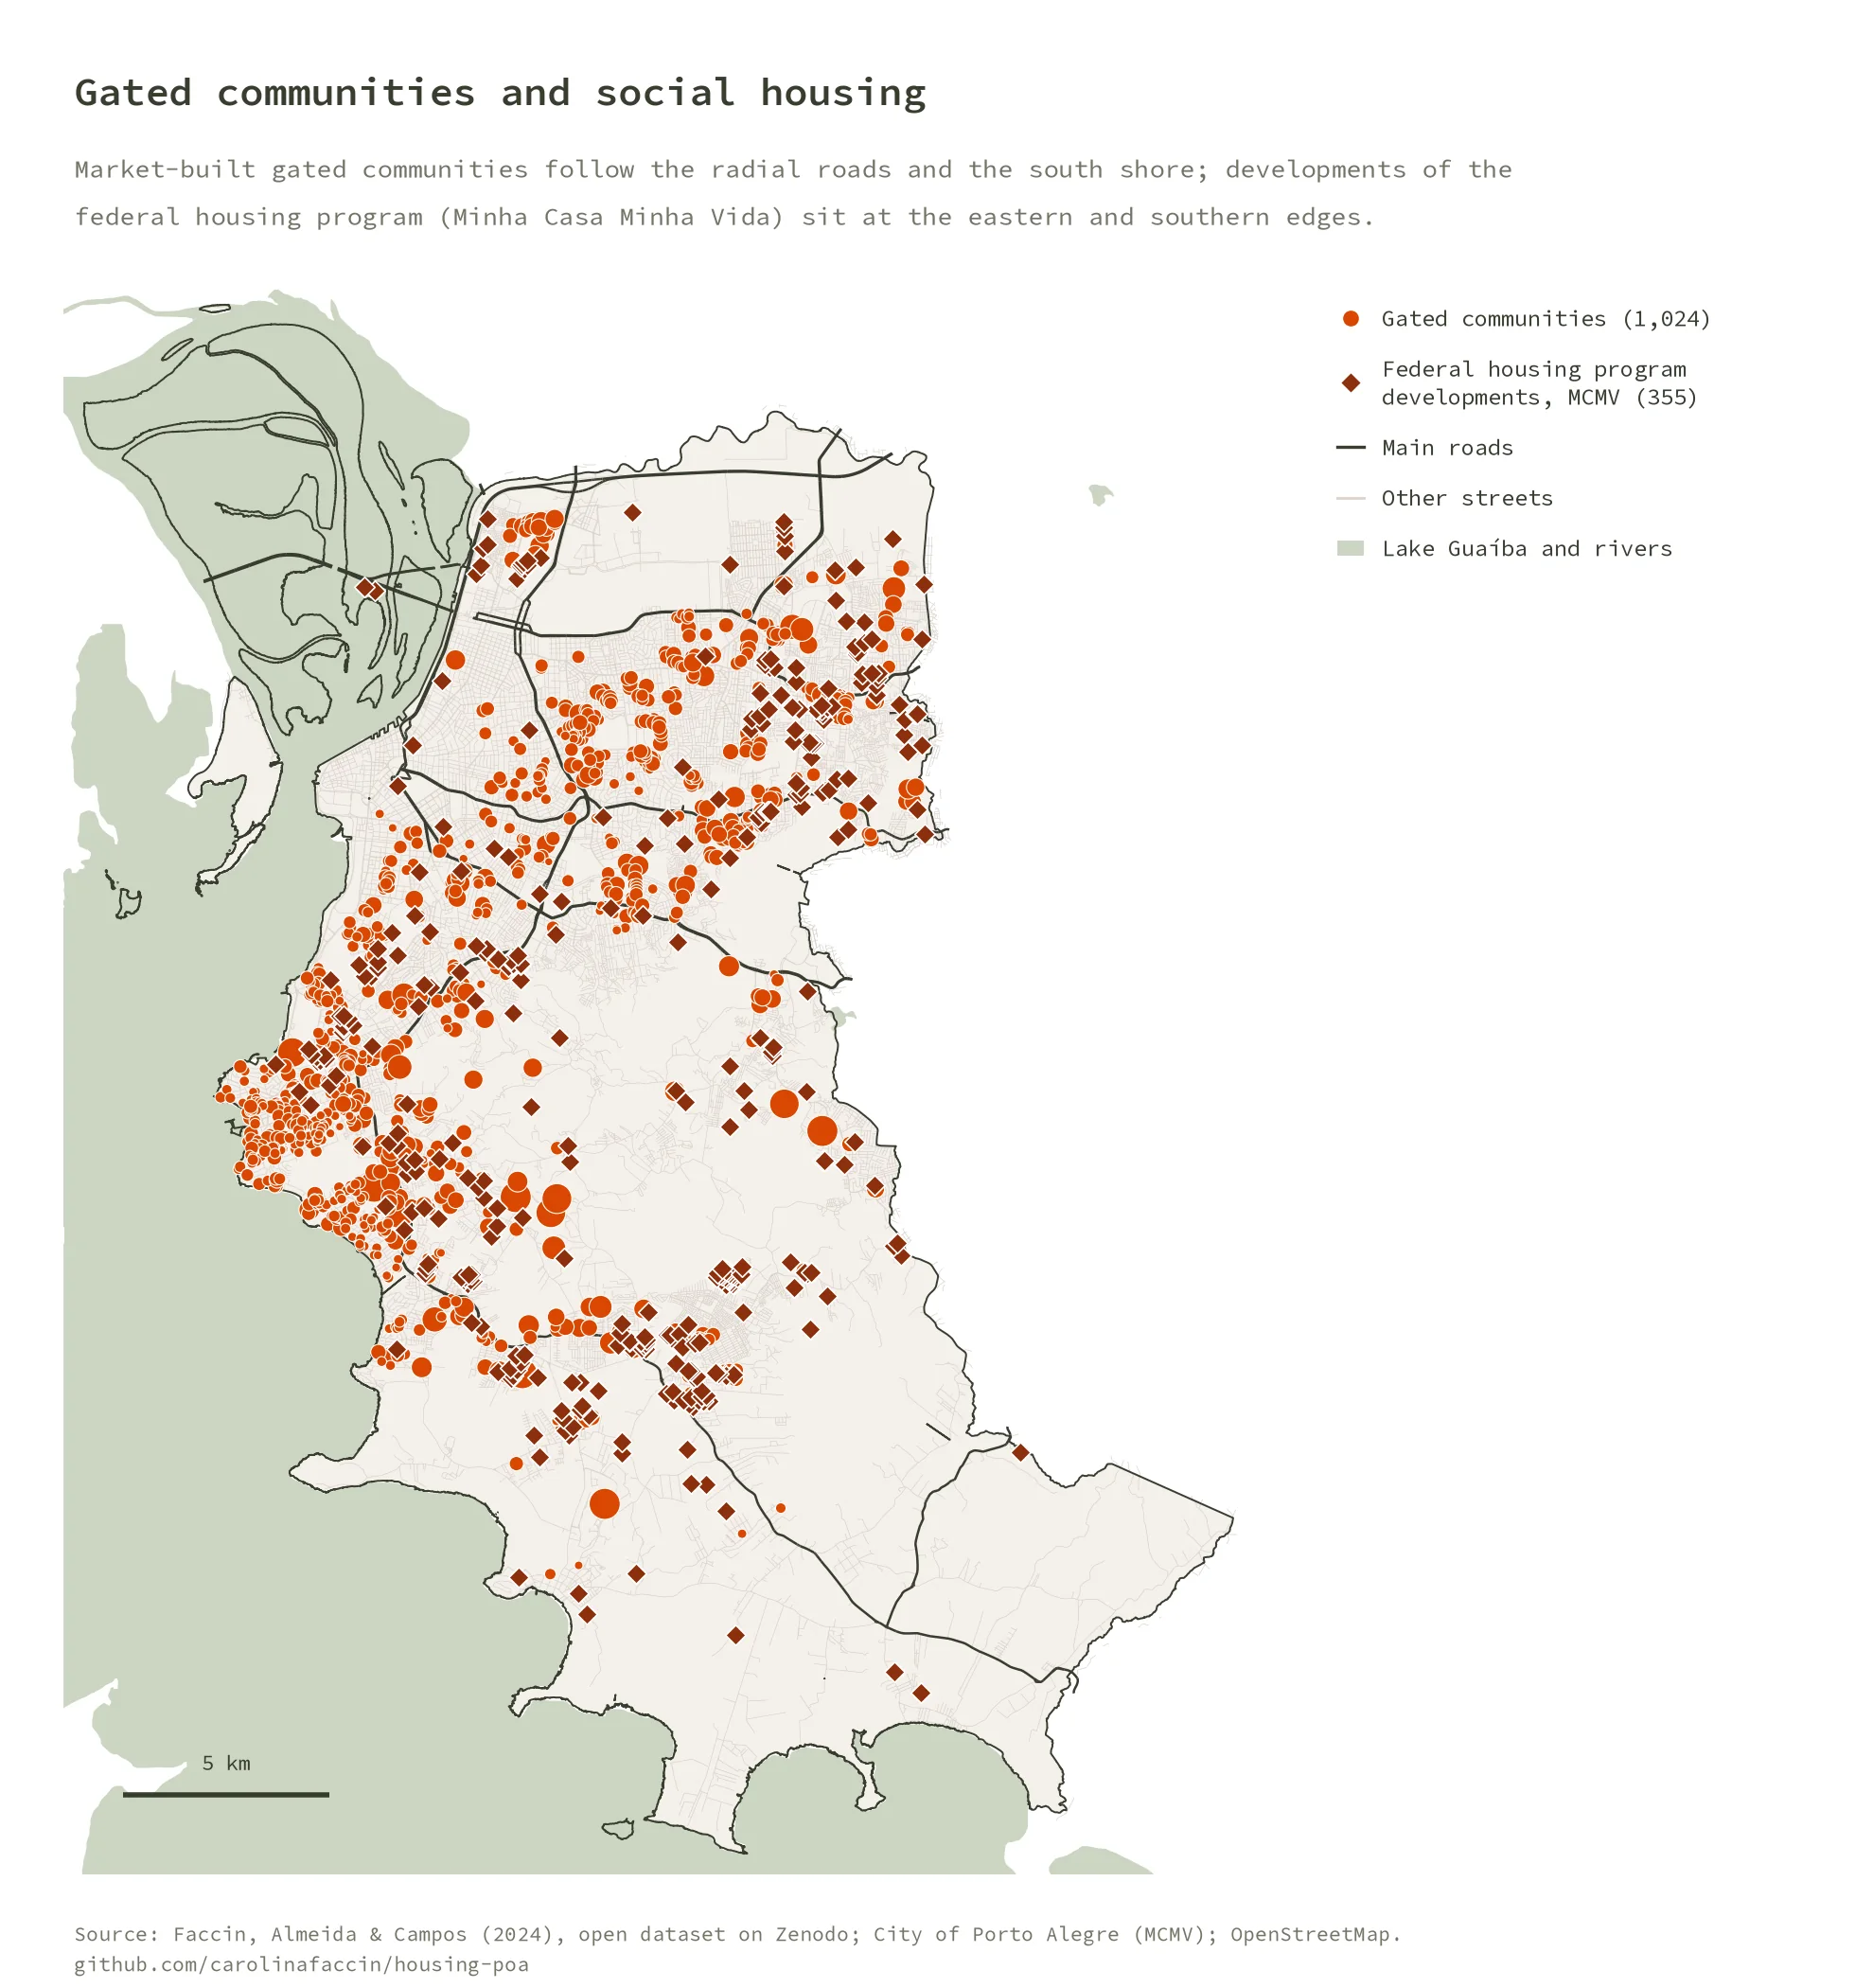
Overlay with census income, neighborhoods, road structure and federal housing program sites
- Outputs
Open dataset (Zenodo) and peer-reviewed paper
Results#
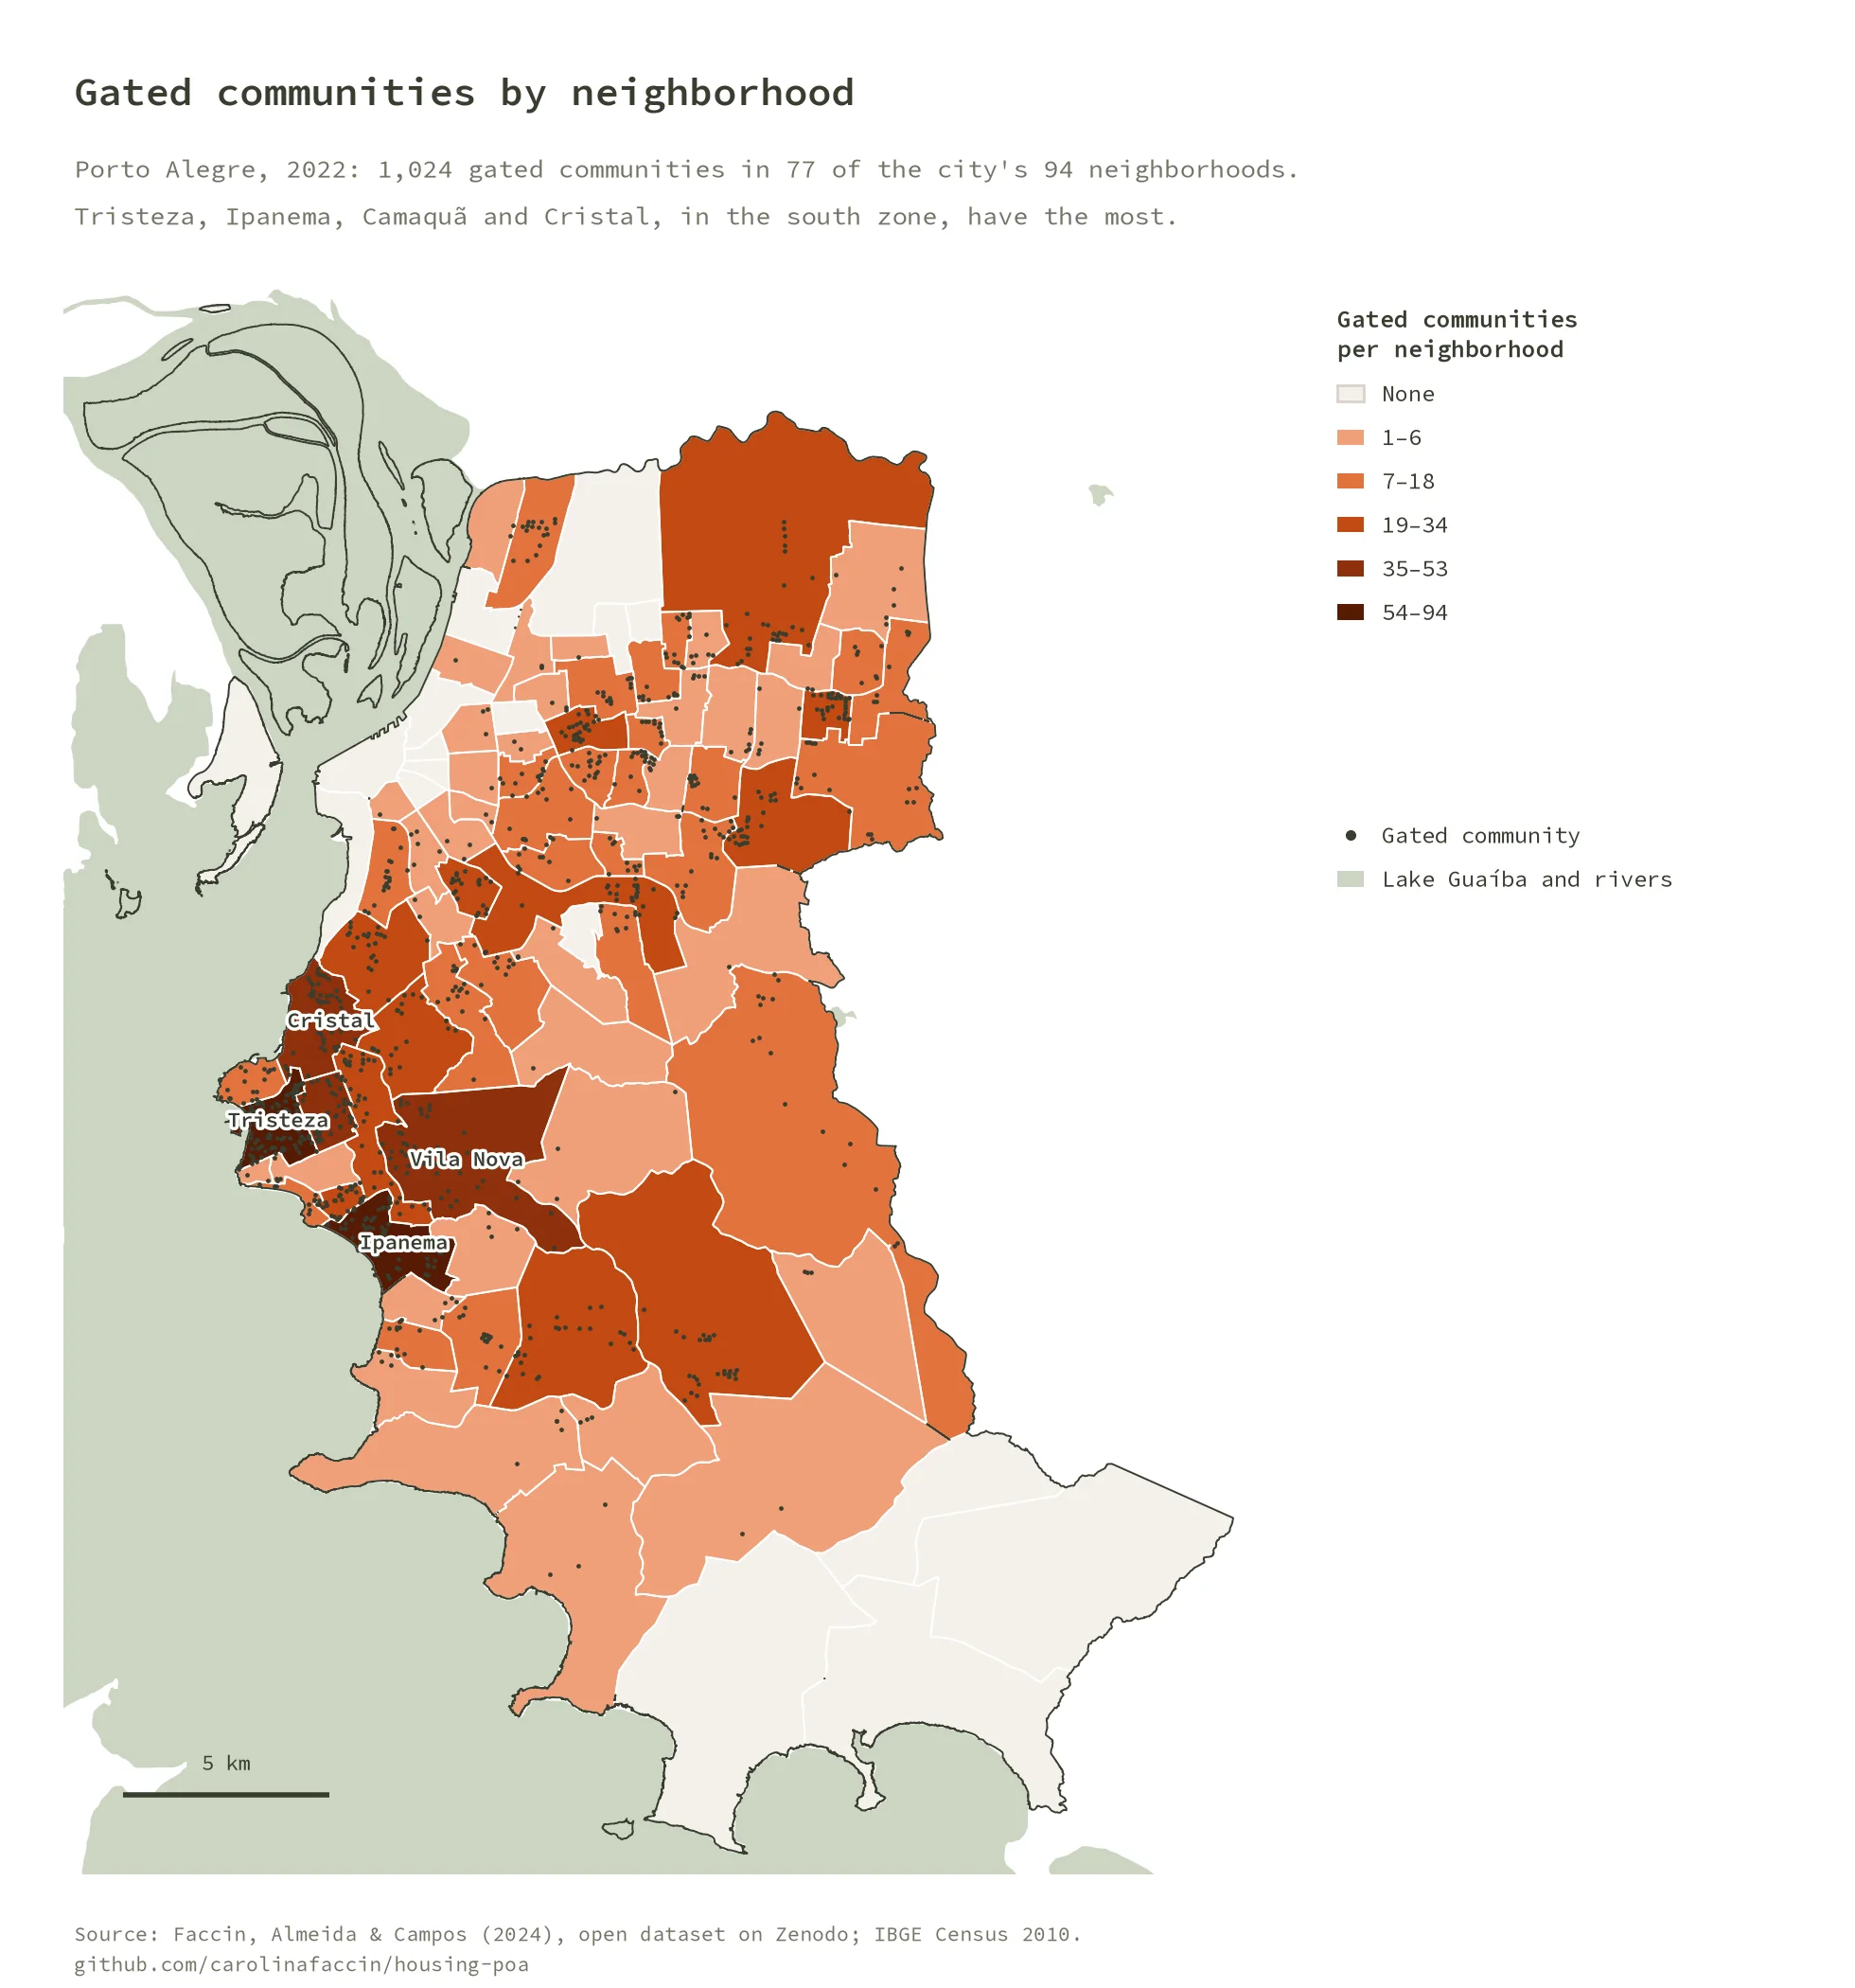
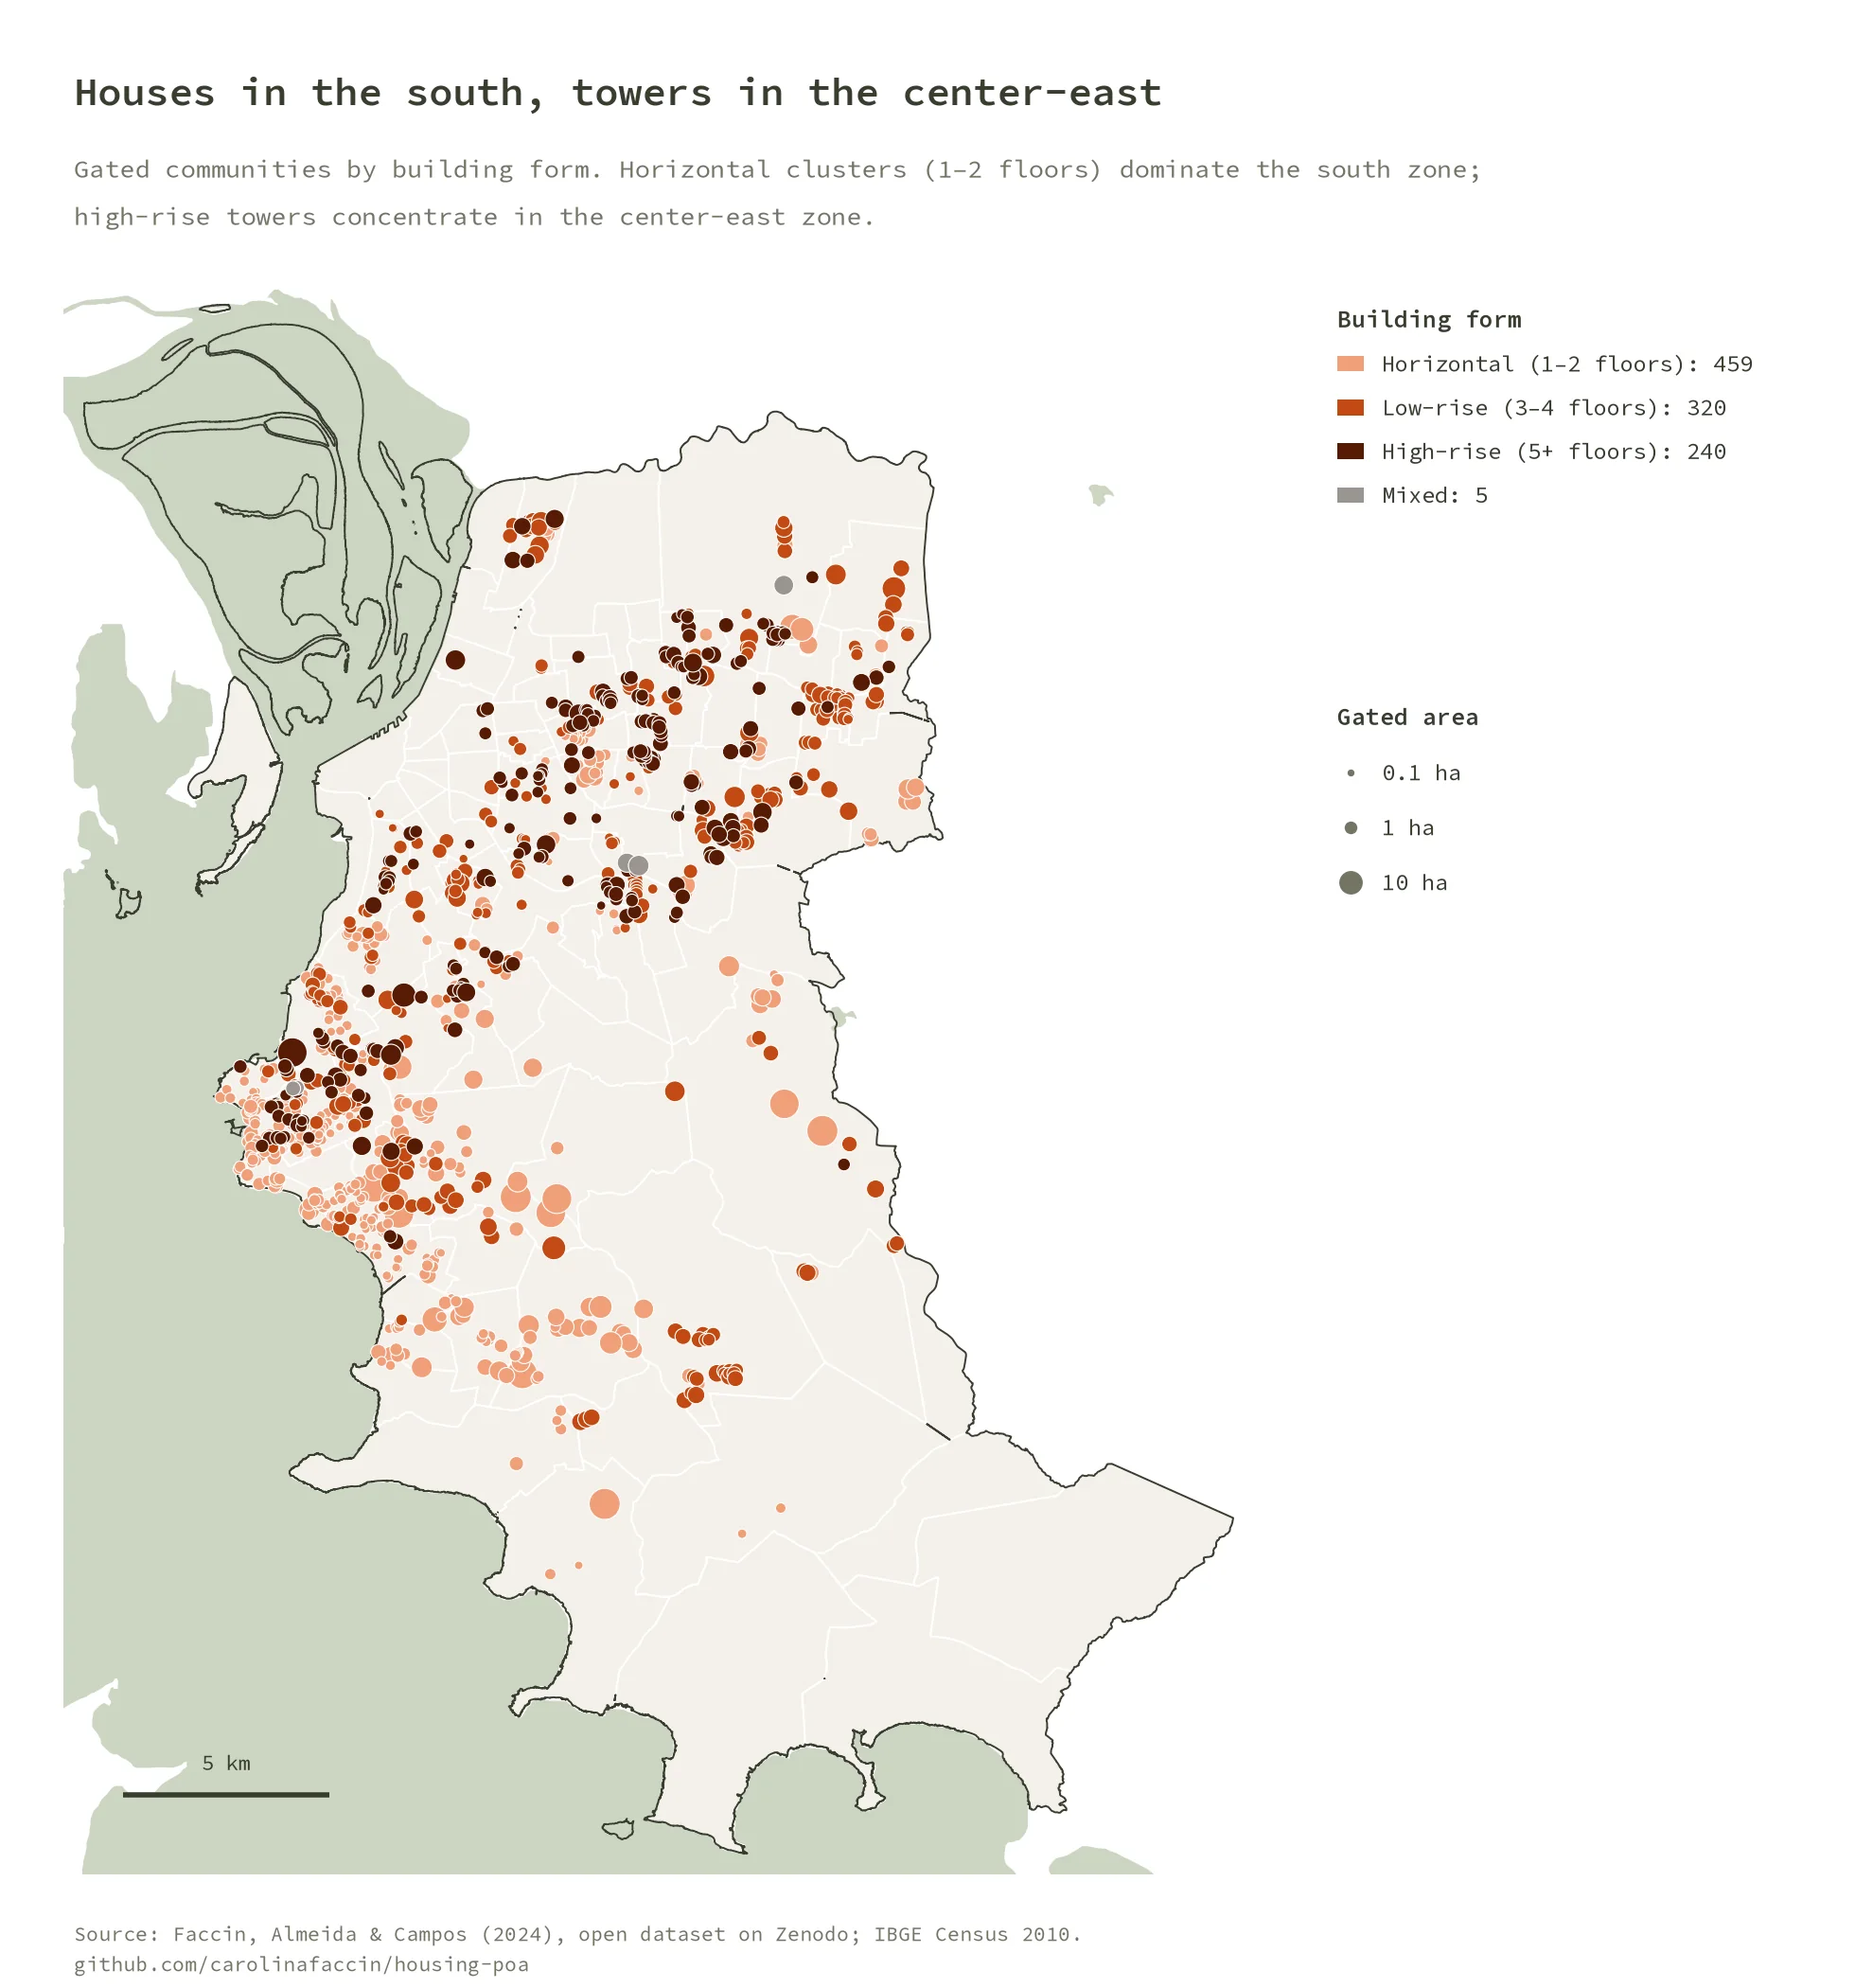
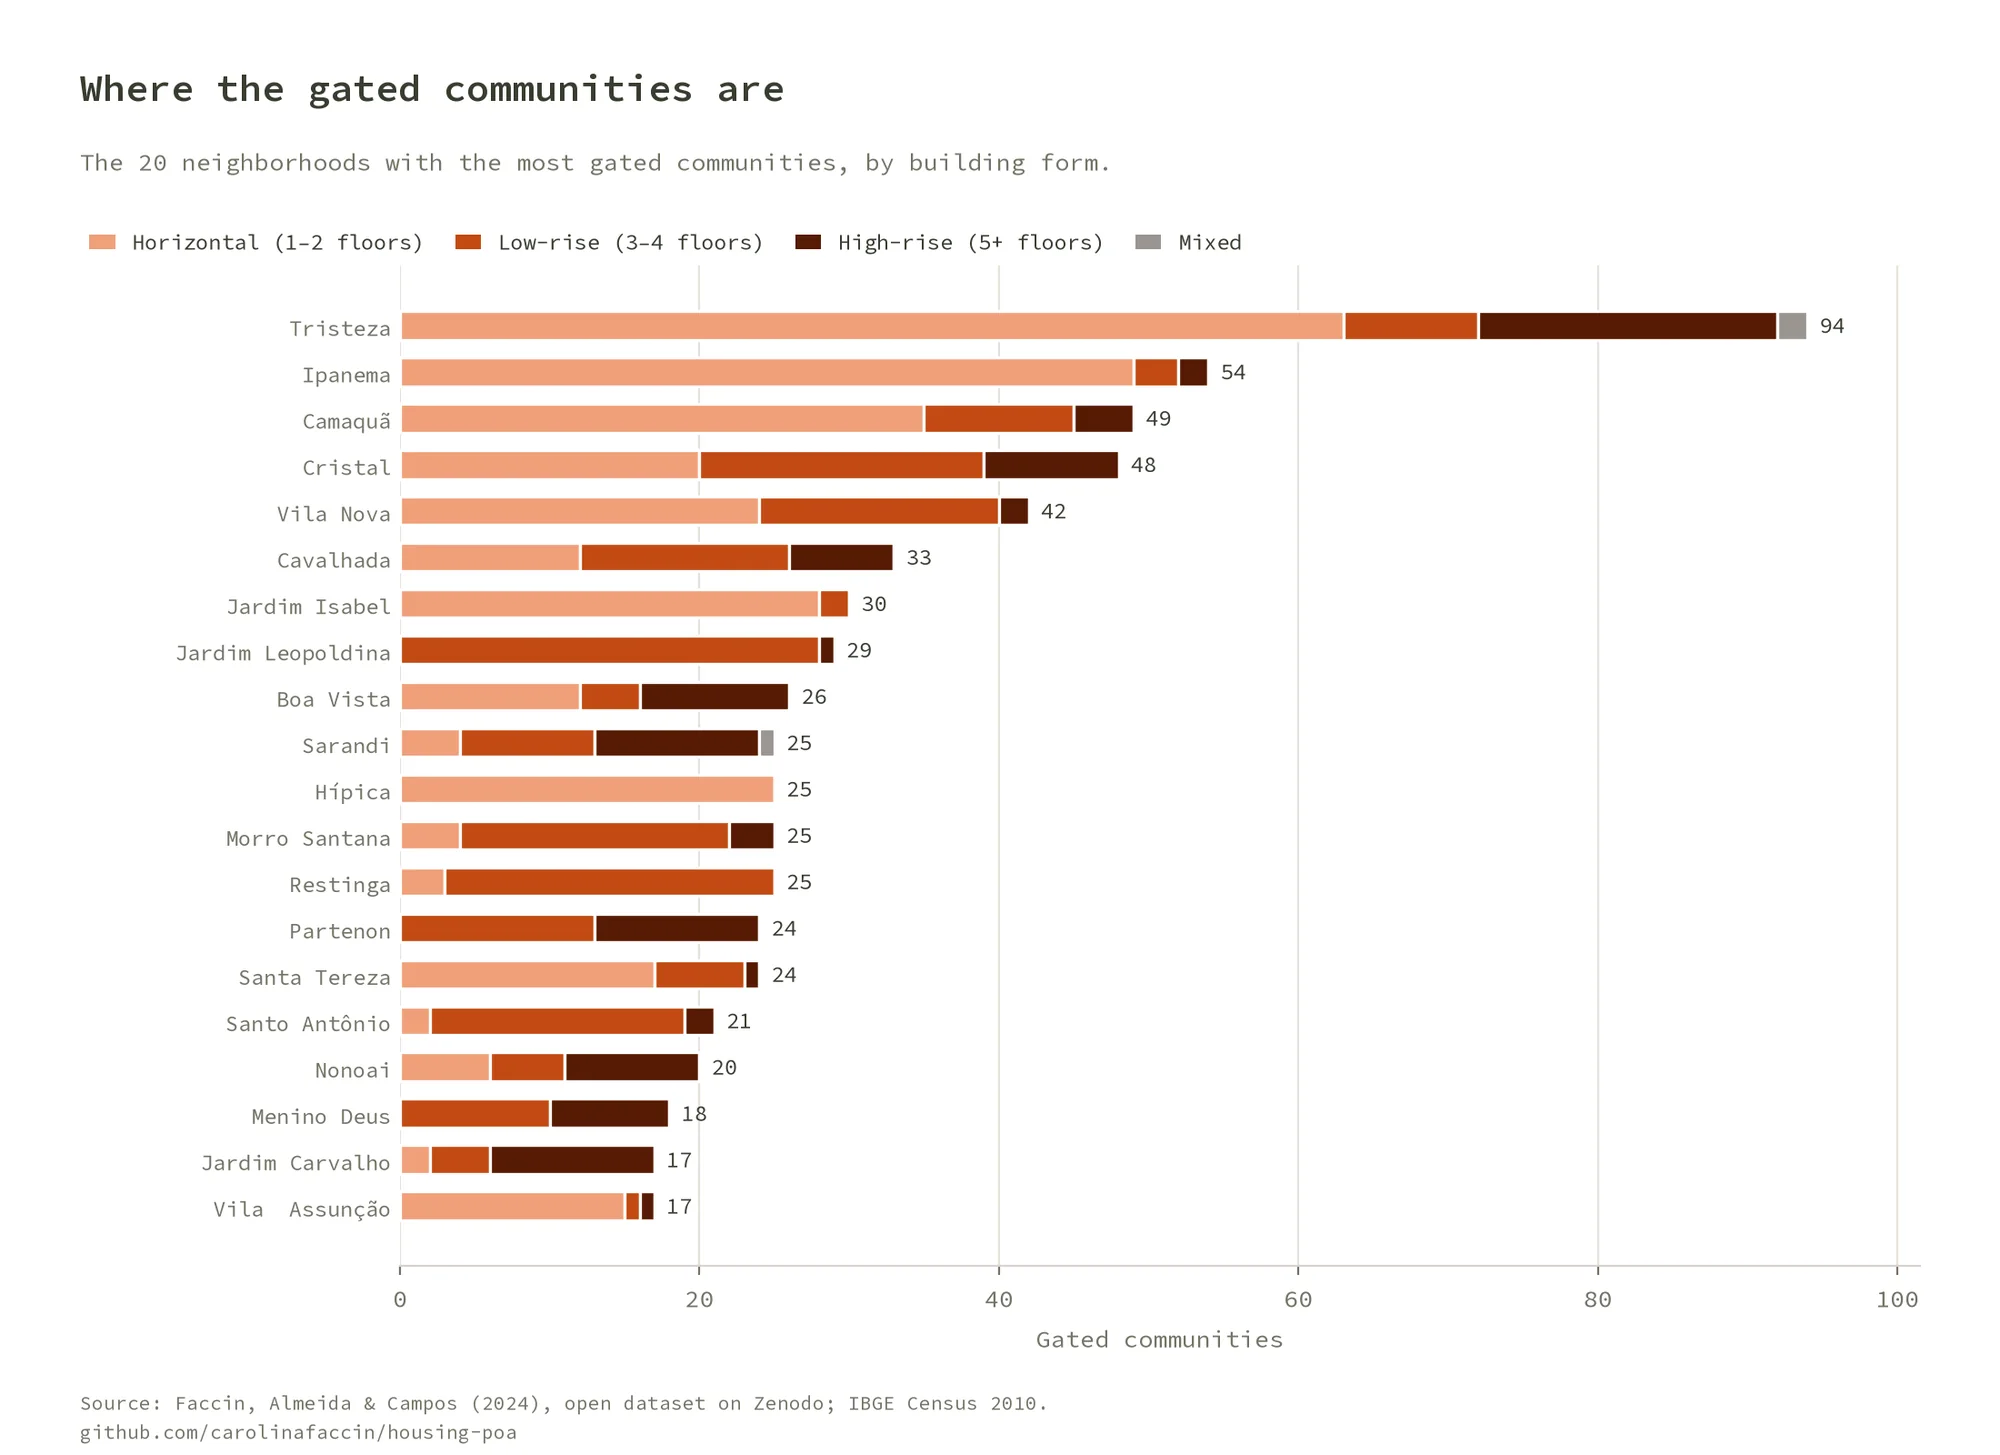
- 1,024 gated communities in 77 of the city’s 94 neighborhoods: 459 horizontal (houses), 560 vertical (apartment blocks and towers) and 5 mixed.
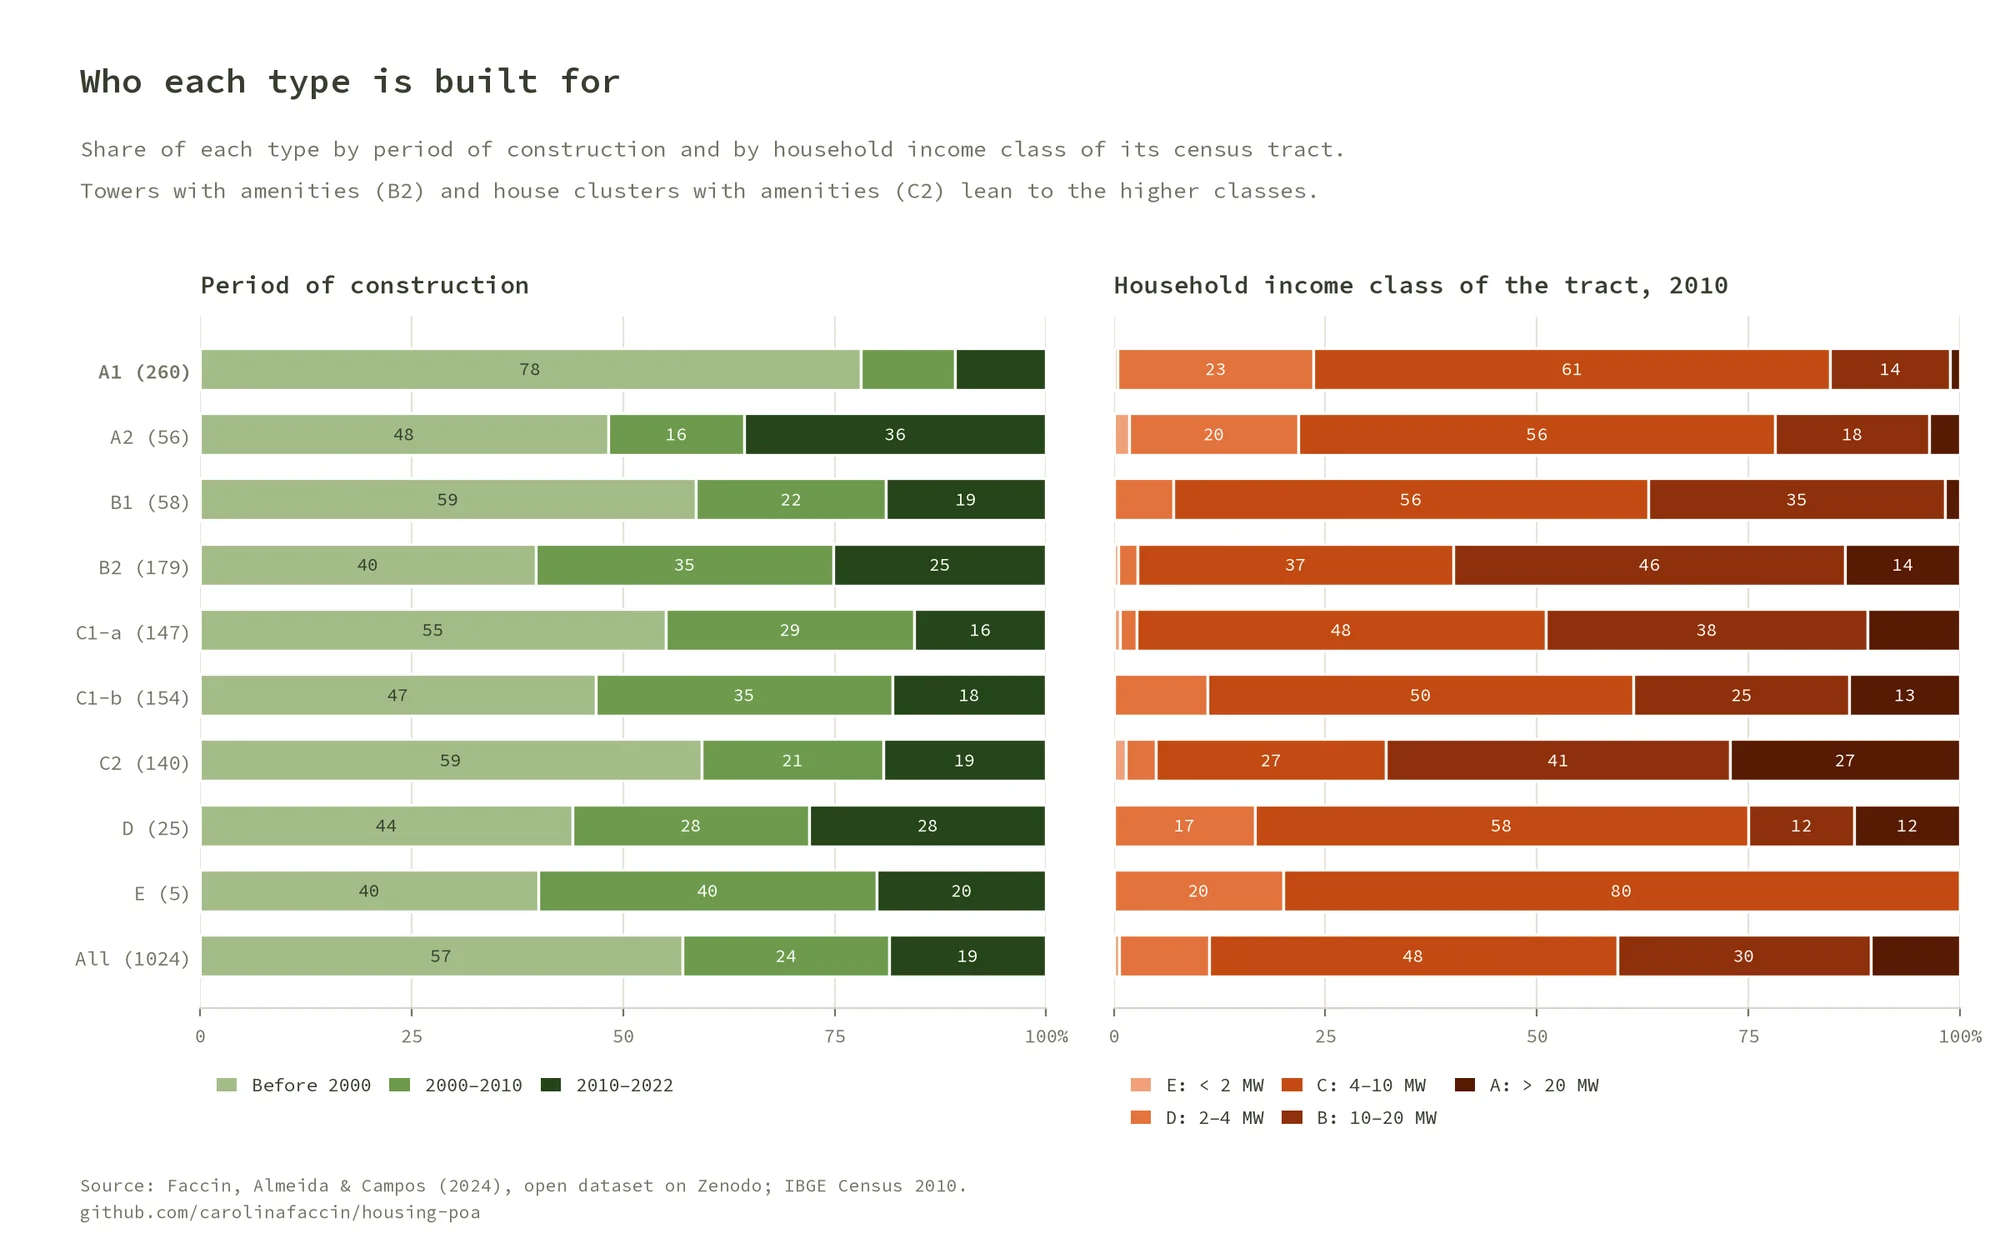
- Nine typologies of gated communities, each associated with a different social segment. Communities with shared amenities lean to the top: 60% of the towers with amenities (B2) and 68% of the house clusters with amenities (C2) sit in census tracts of the two highest income classes.
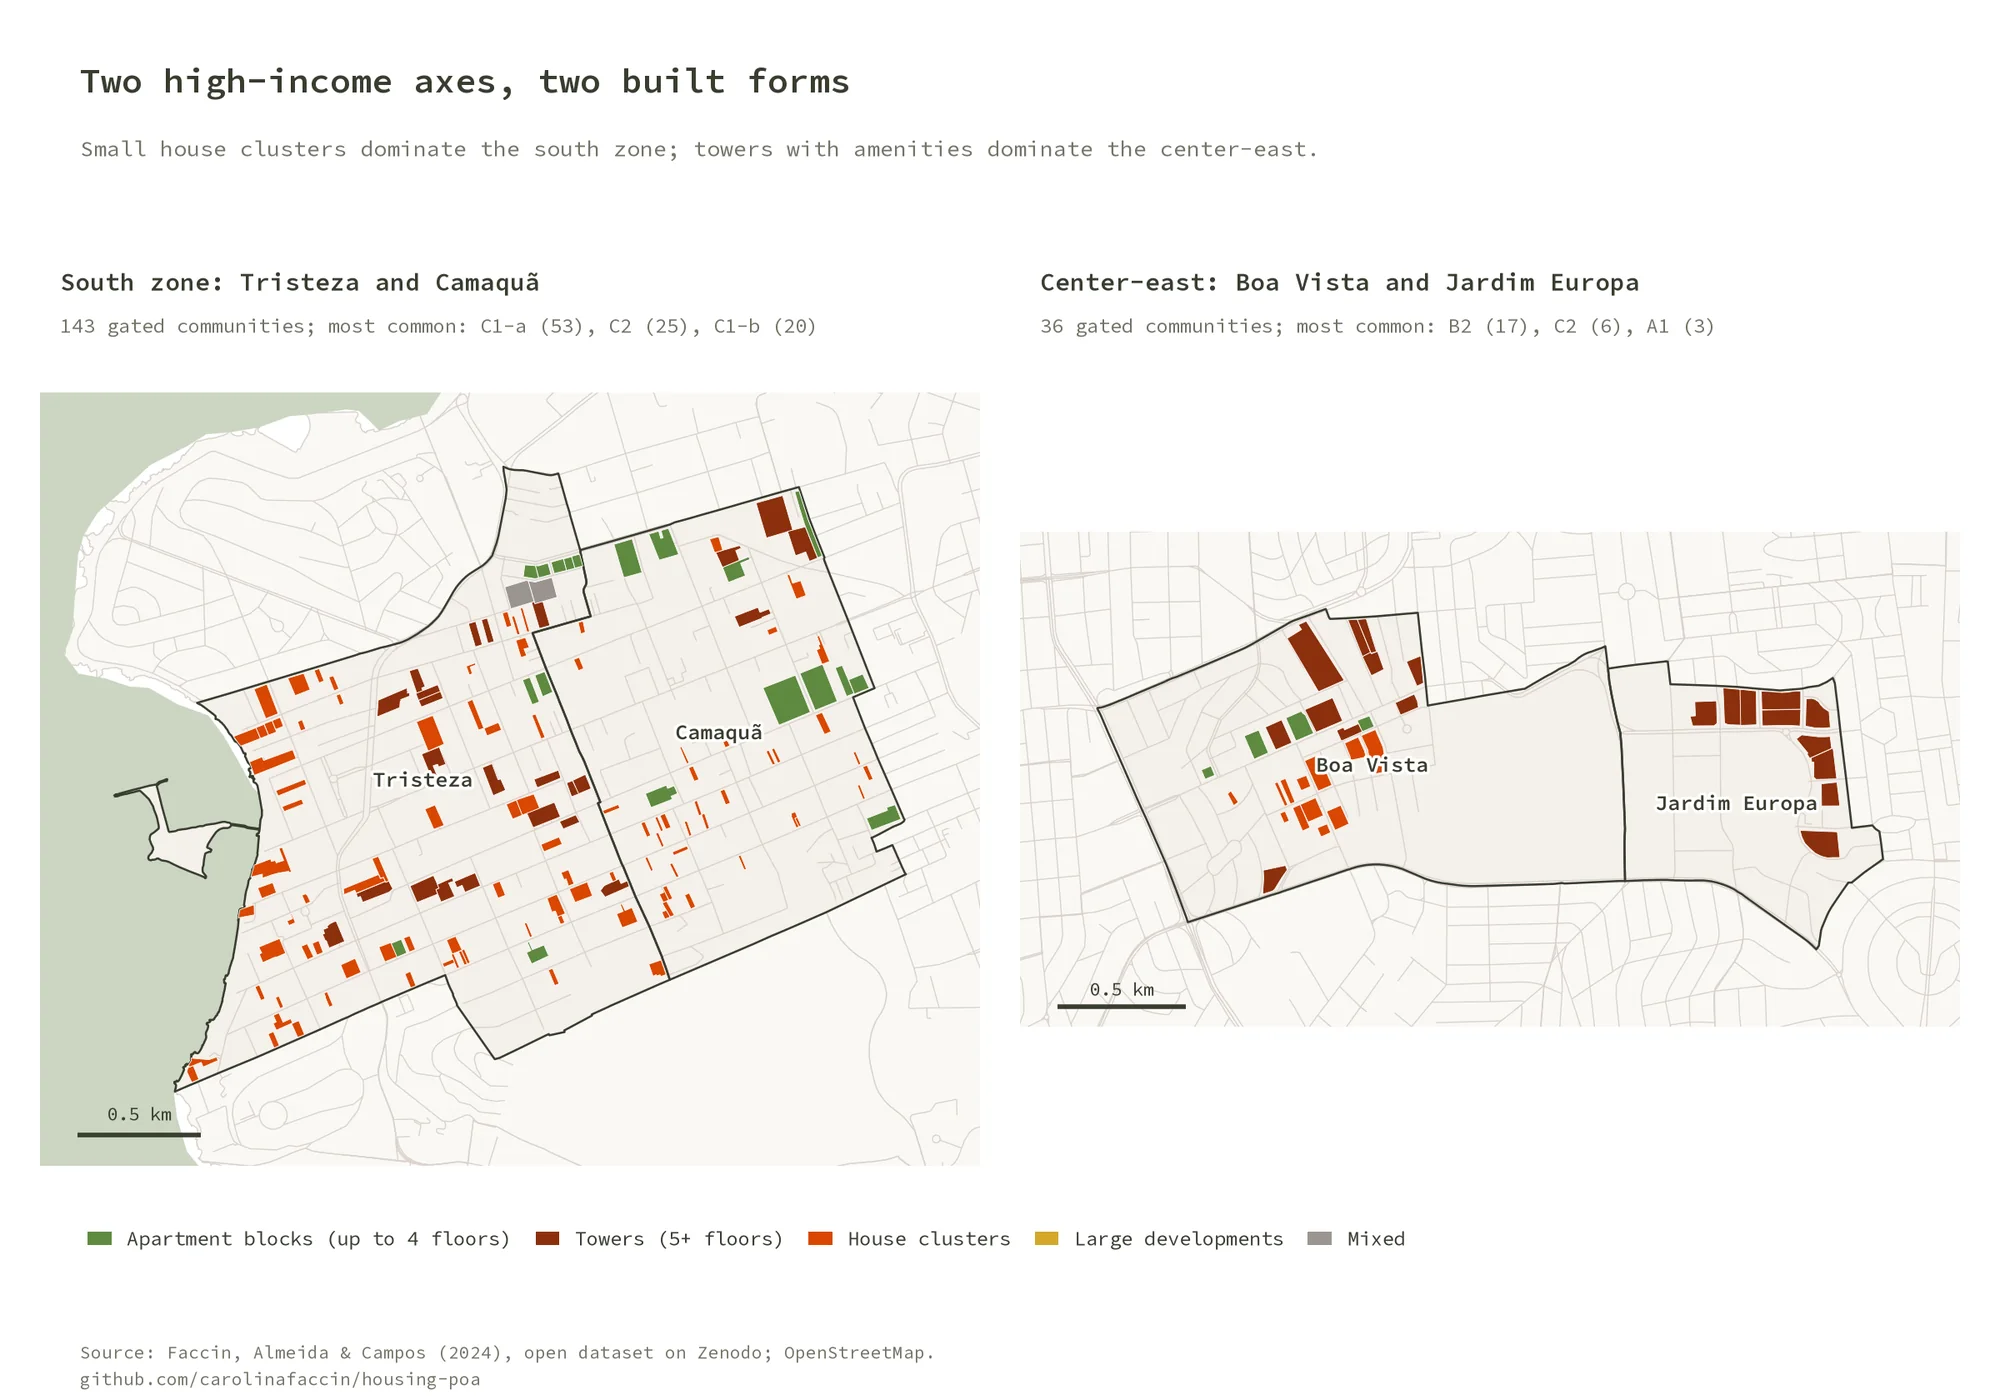
- A clear morphological segregation: small-scale horizontal condominiums (townhouses and single-family homes) predominate in the South Zone, while high-rise towers for high-income households concentrate in the Center-East Zone.
- Detailed comparisons of contrasting neighborhoods: Boa Vista and Jardim Europa in the north, Tristeza and Camaquã in the south.
Why it matters#
The dataset turns a much-debated phenomenon into something that can be measured. It is openly available for planners, researchers and journalists who want to study housing, segregation or real estate dynamics in Porto Alegre.
I later rebuilt the analysis as an open, reproducible Python pipeline that checks its results against the numbers published in the paper: code and figures on GitHub.
- Open dataset on Zenodo
- Faccin, Almeida & Campos (2024) (PT): Urban morphology and typology of gated communities in the Porto Alegre metropolis.
- Lahorgue et al. (2022) (PT): housing situation and perspectives in Porto Alegre.
Related research on real estate production:
- Almeida, Faccin & Campos (2025) (PT): studios and compact apartments conceived as financial assets for rental income.
- Almeida, Morlin Filho & Faccin (2025) (PT): real estate production in Porto Alegre and the agents involved.
Figures#
Produced by the open pipeline above.