- Period
- 2024
- Location
- Rio Pardo Valley and Taquari Valley, Rio Grande do Sul, Brazil
- Partners
- Volunteer task force of researchers; report delivered to public managers through COREDE Vale do Rio Pardo
- My role
- Co-author of the technical report and the paper; responsible for the geospatial analysis that identified the urban areas and buildings reached by the flood.
- Data
- IPH/UFRGS flood extent (6 May 2024) · Google Open Buildings · IBGE census tracts (2010) · DAER-RS highways
- Tools & methods
- QGIS · Python · Spatial overlay analysis · Documentary analysis of planning instruments
The challenge#
In May 2024, Rio Grande do Sul faced the worst climate disaster in its history. Small cities in the Rio Pardo and Taquari valleys, many with limited technical staff, had to make emergency decisions without an overview of which neighborhoods and buildings had been reached by the water.
Approach#
A volunteer task force of researchers came together to produce a technical report in a few weeks. I led the geospatial analysis, crossing the observed flood extent with building footprints, and the team reviewed the municipalities’ existing planning instruments.
- Flood extent
Observed flood area of 6 May 2024 (IPH/UFRGS)
- Exposure
Building footprints (Google Open Buildings) and 2010 census tracts (urban or rural)
- Overlay
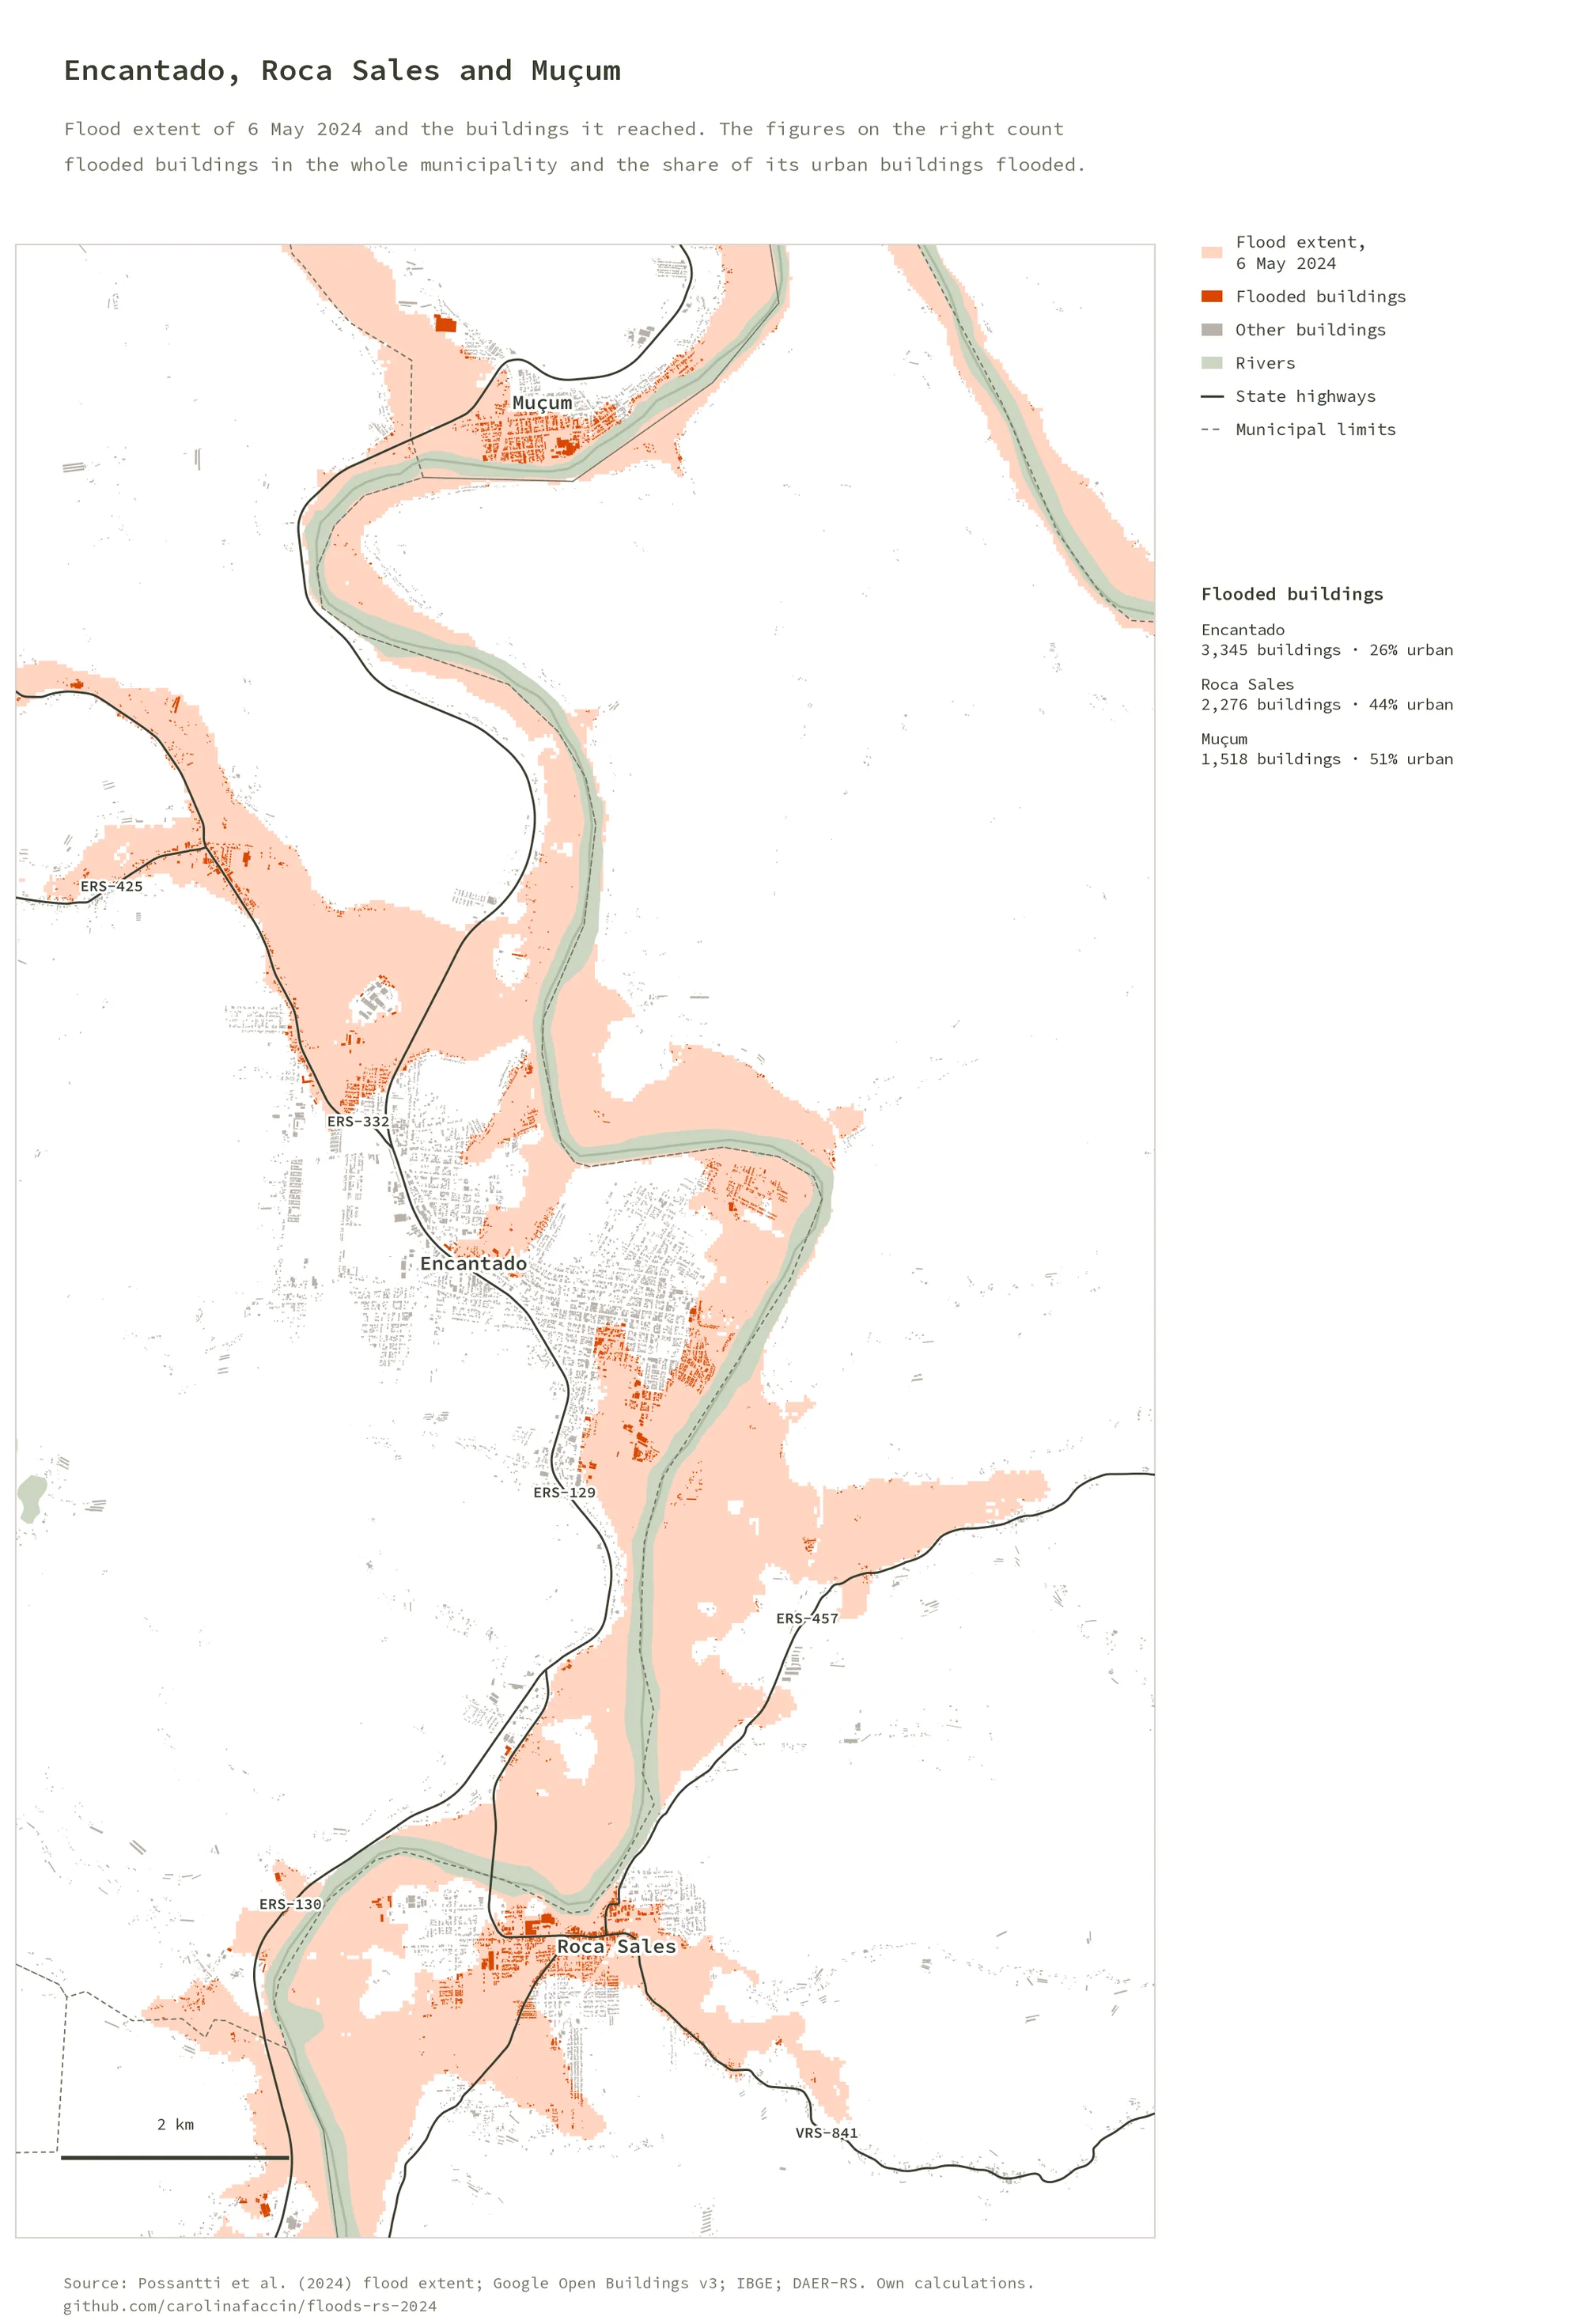
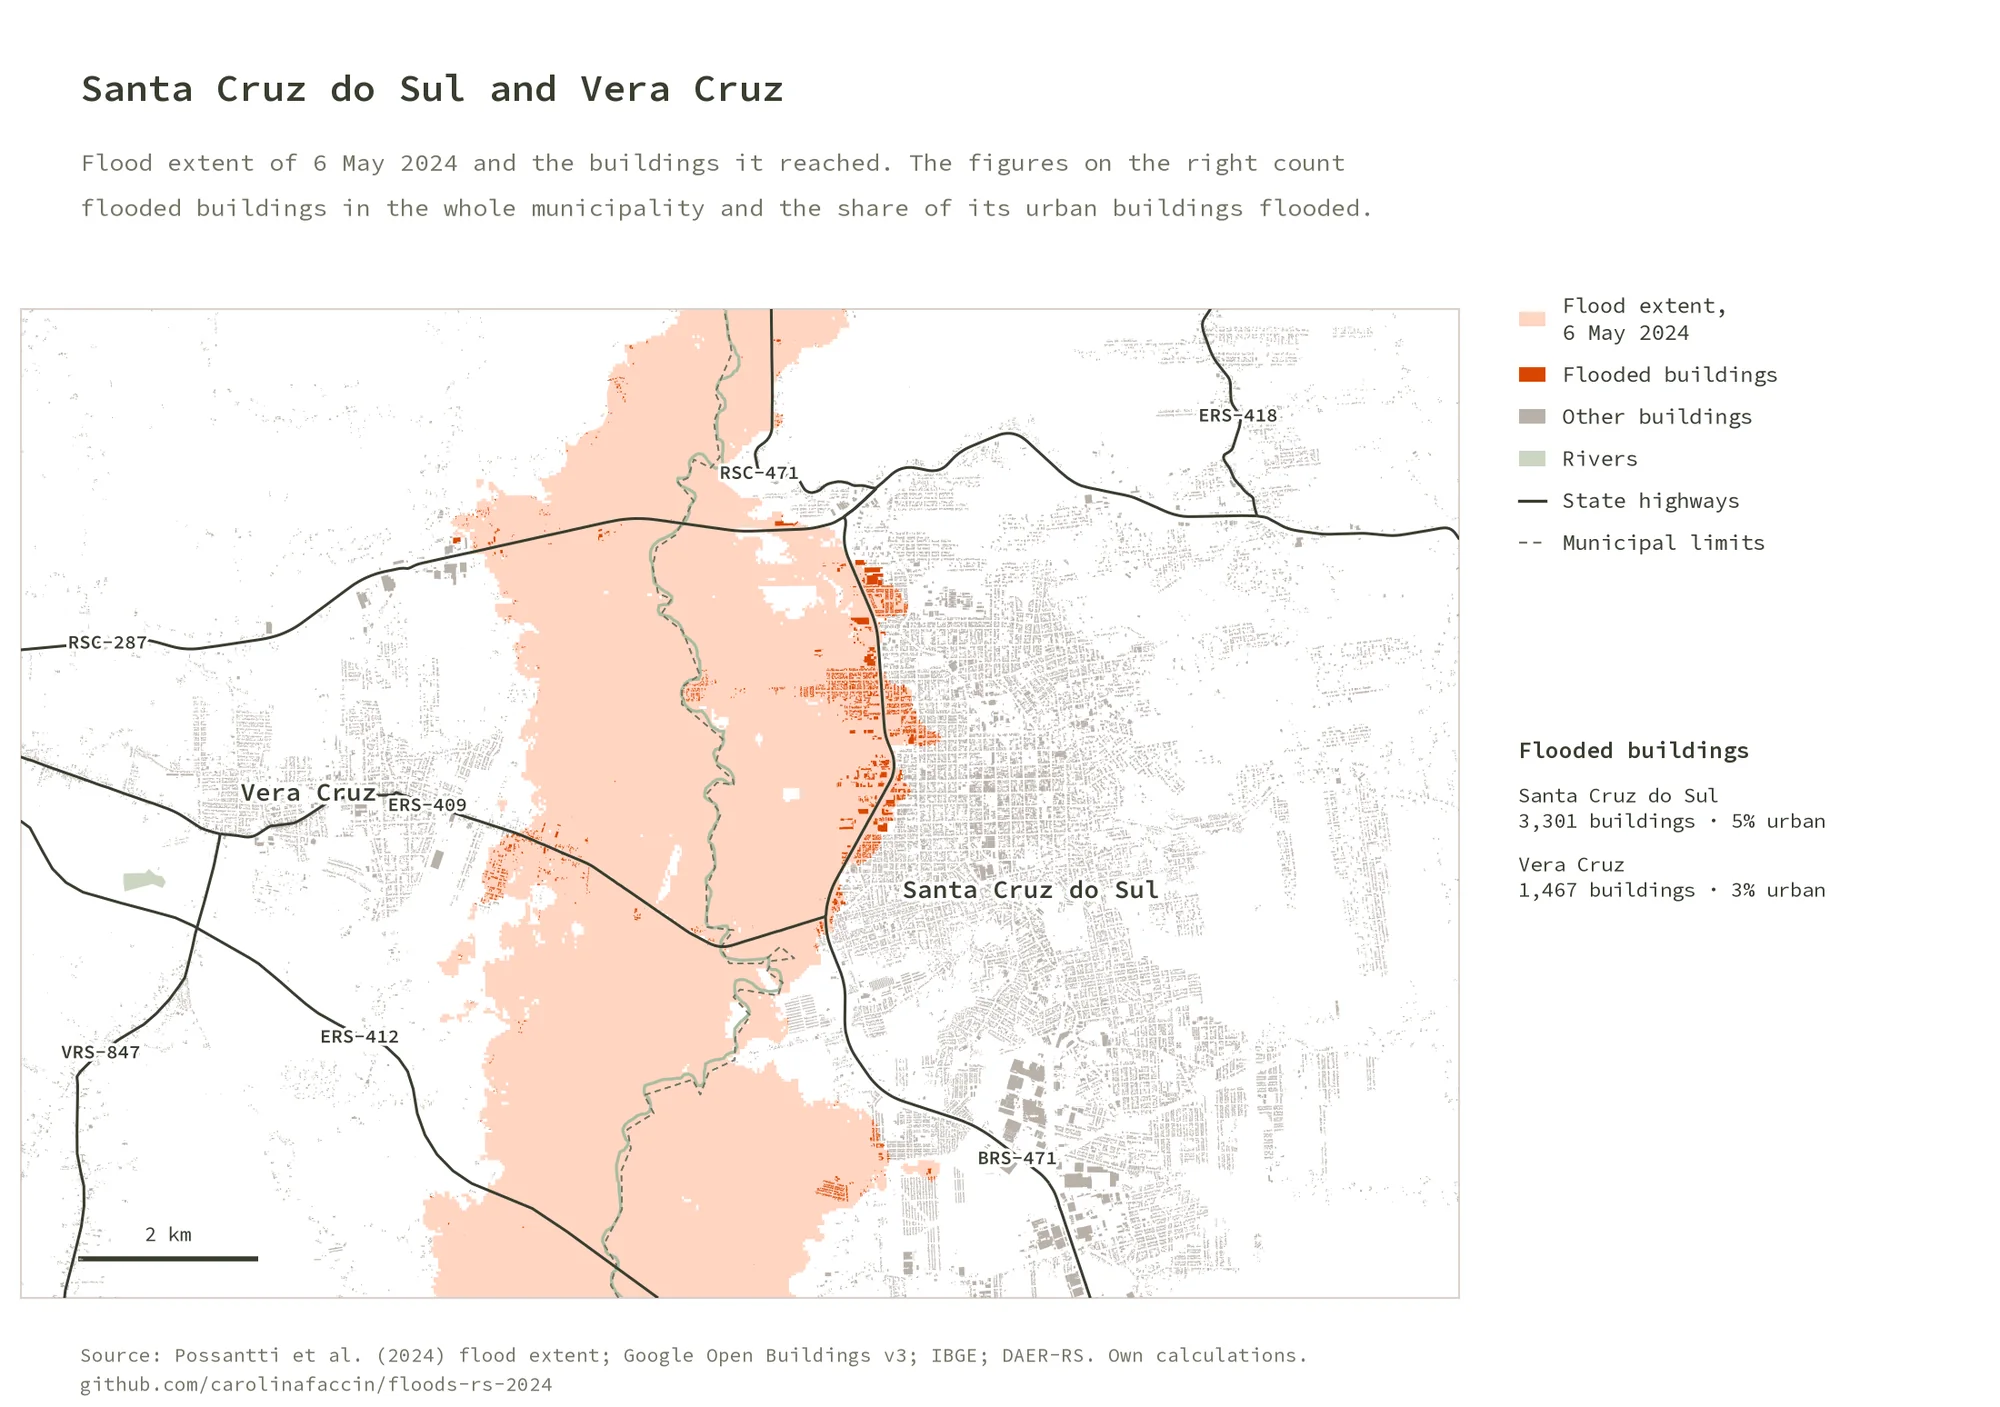
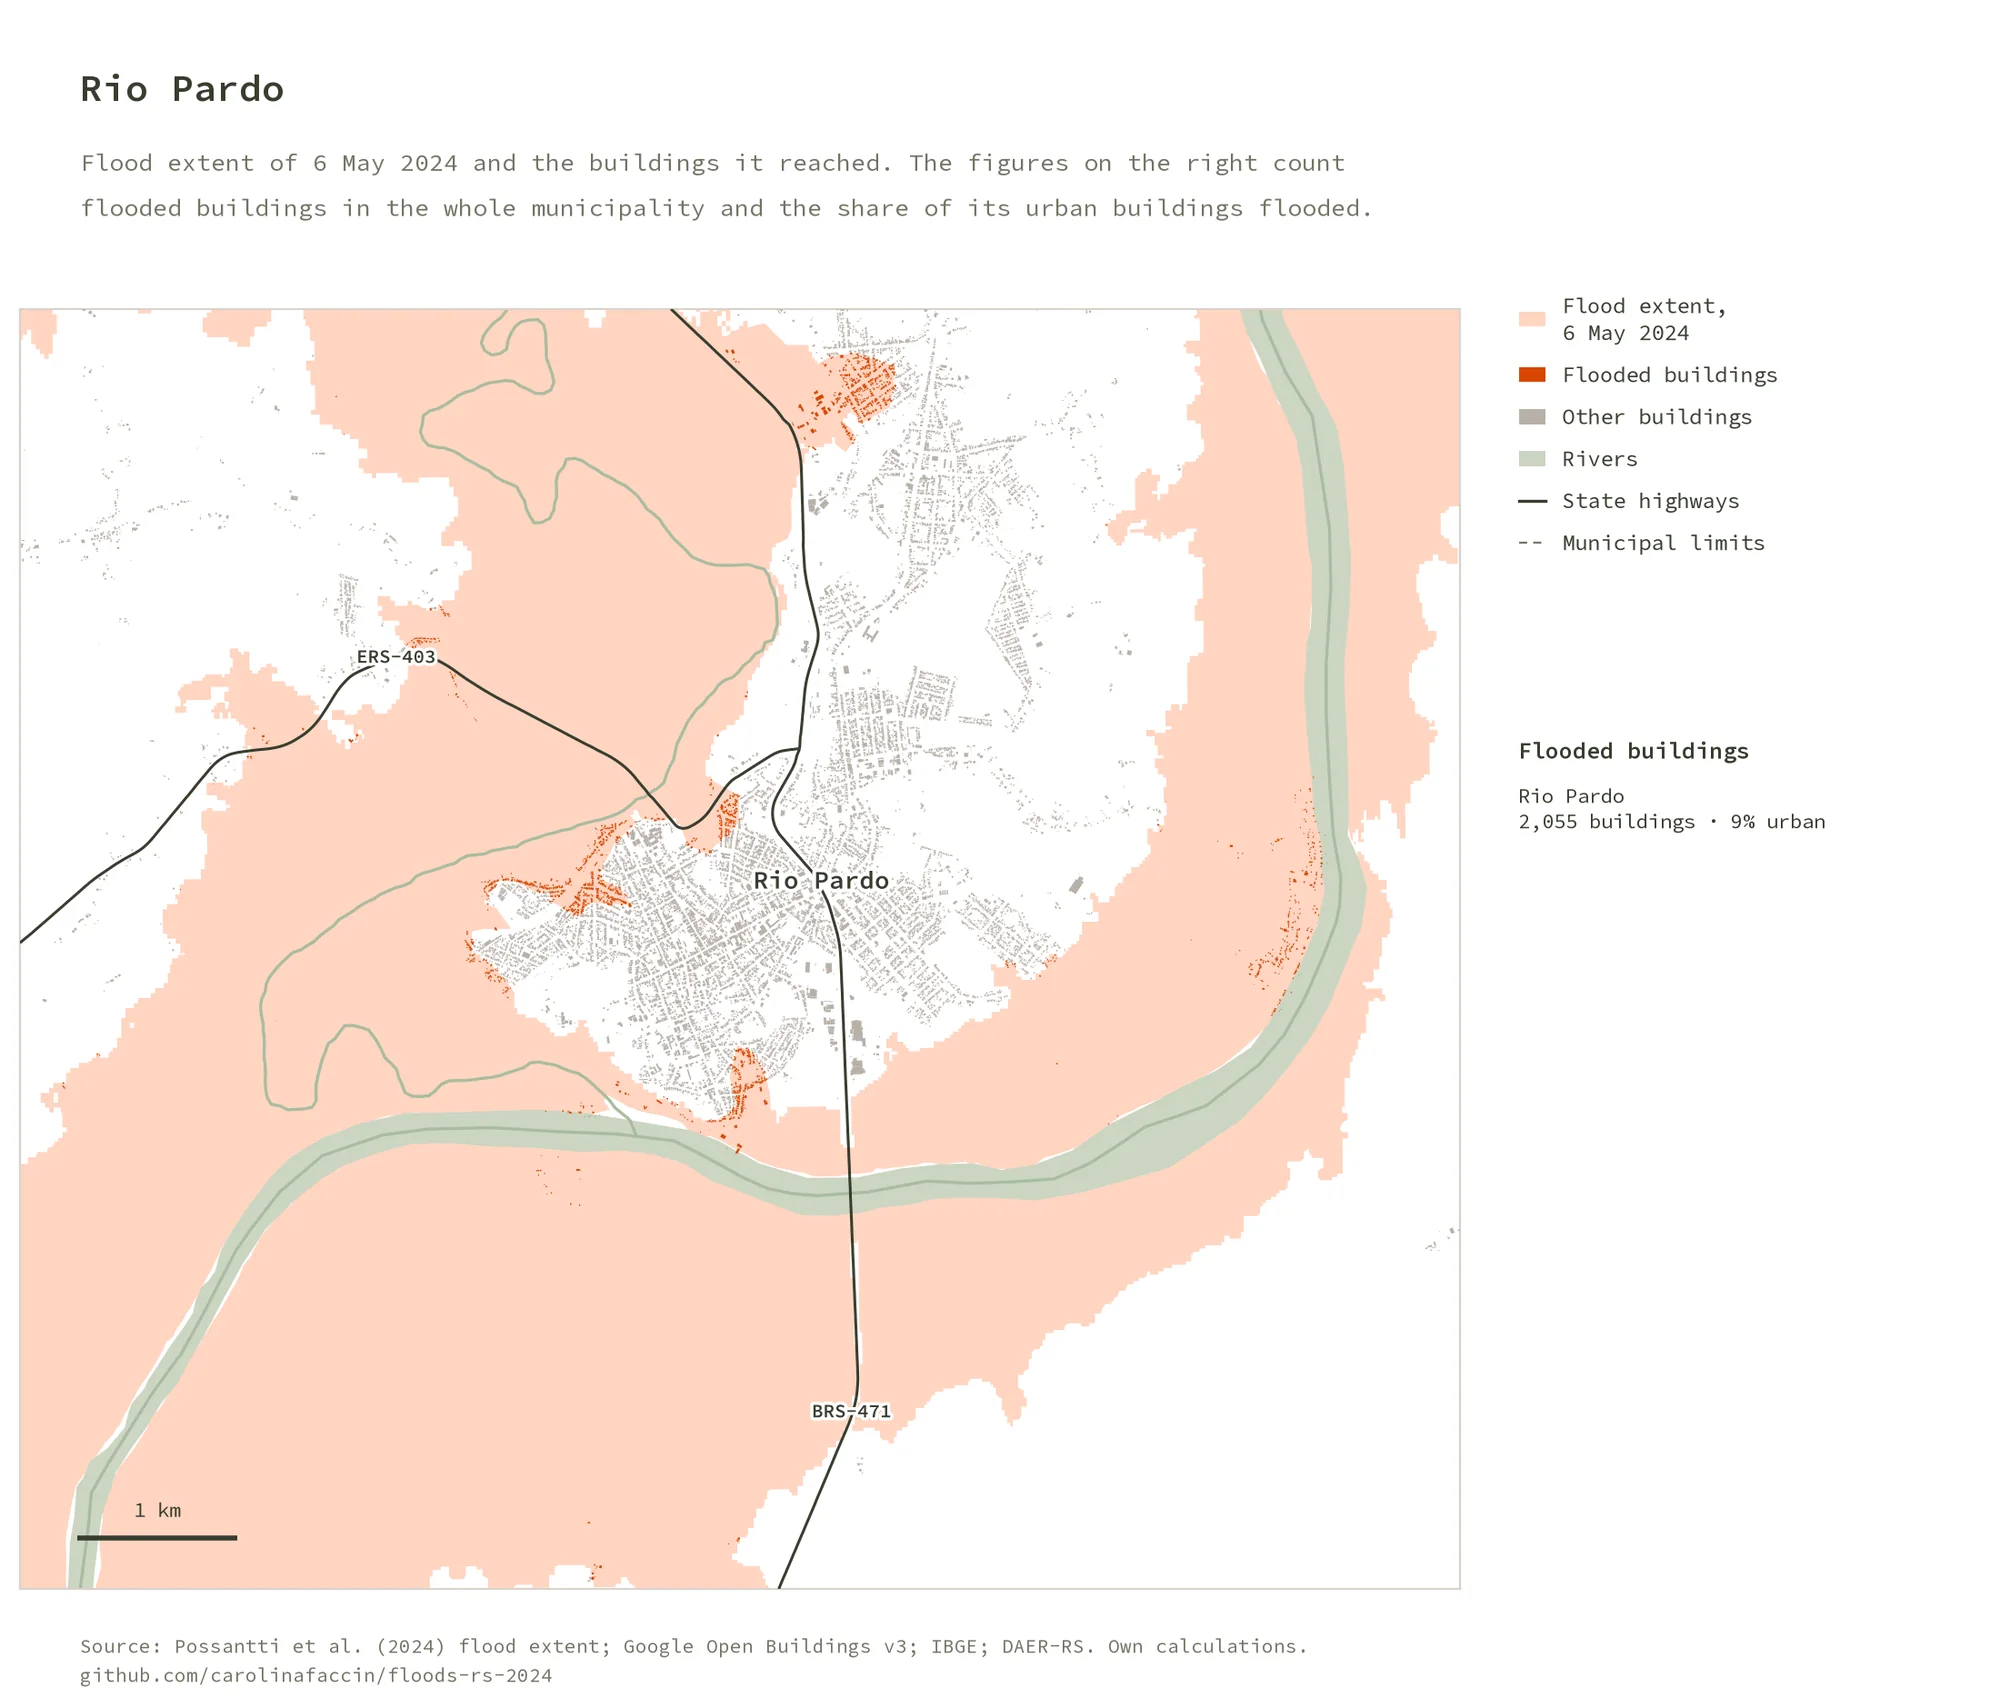
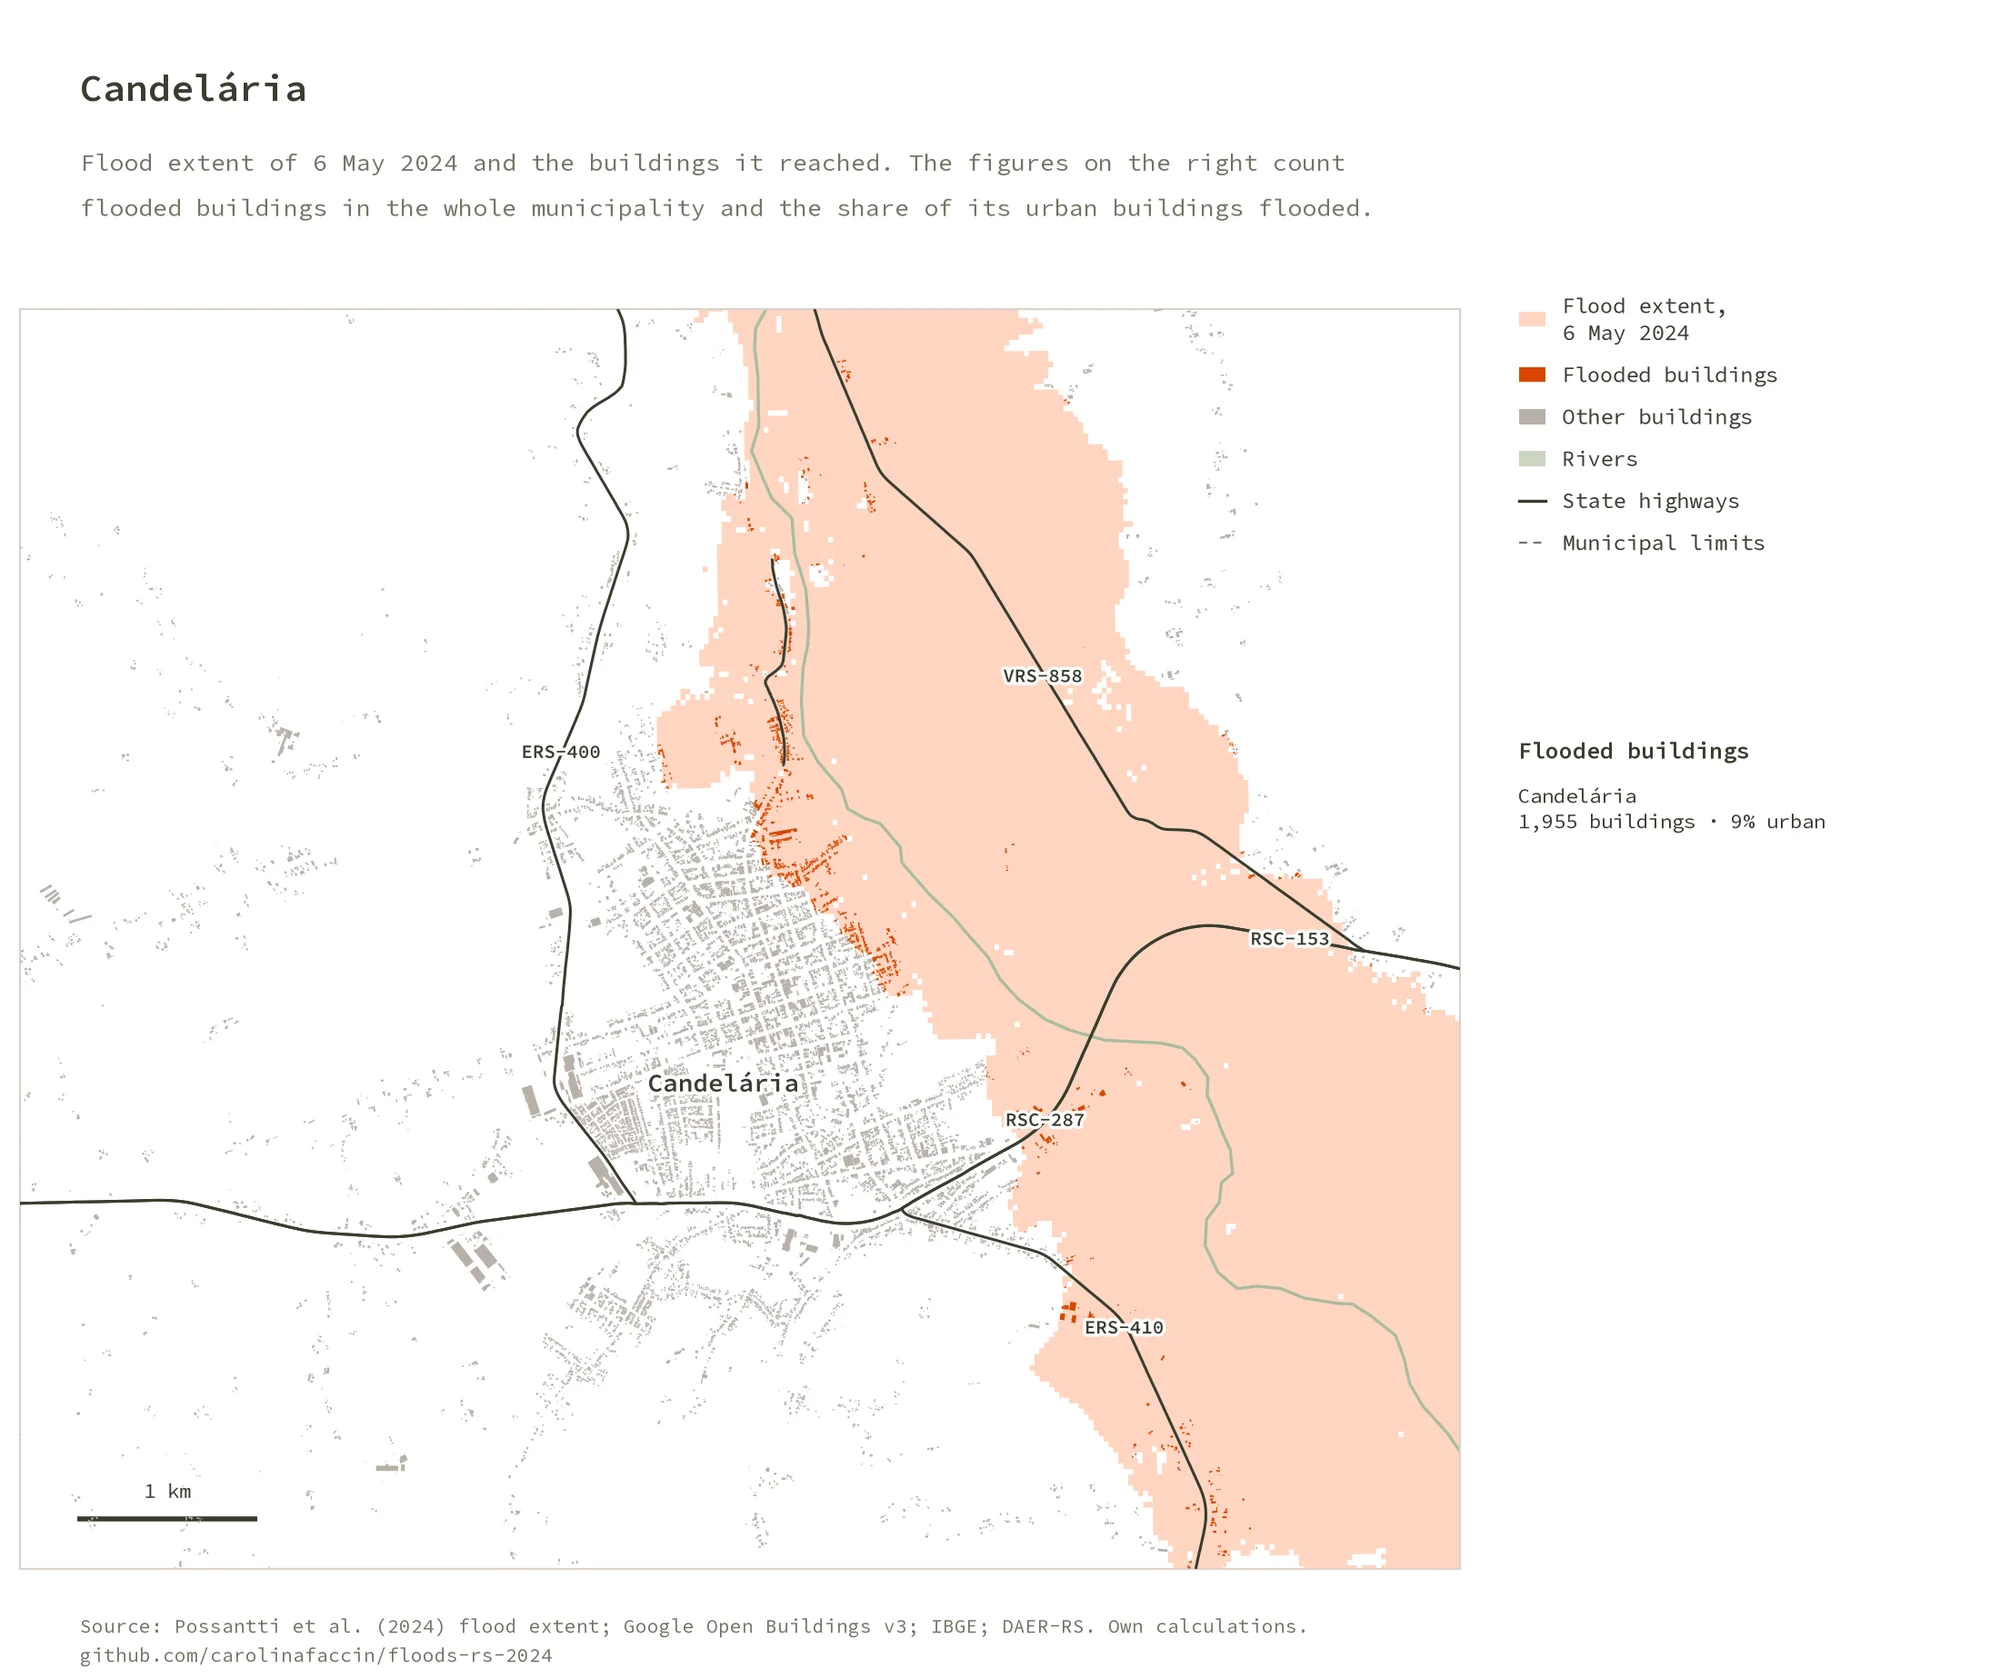
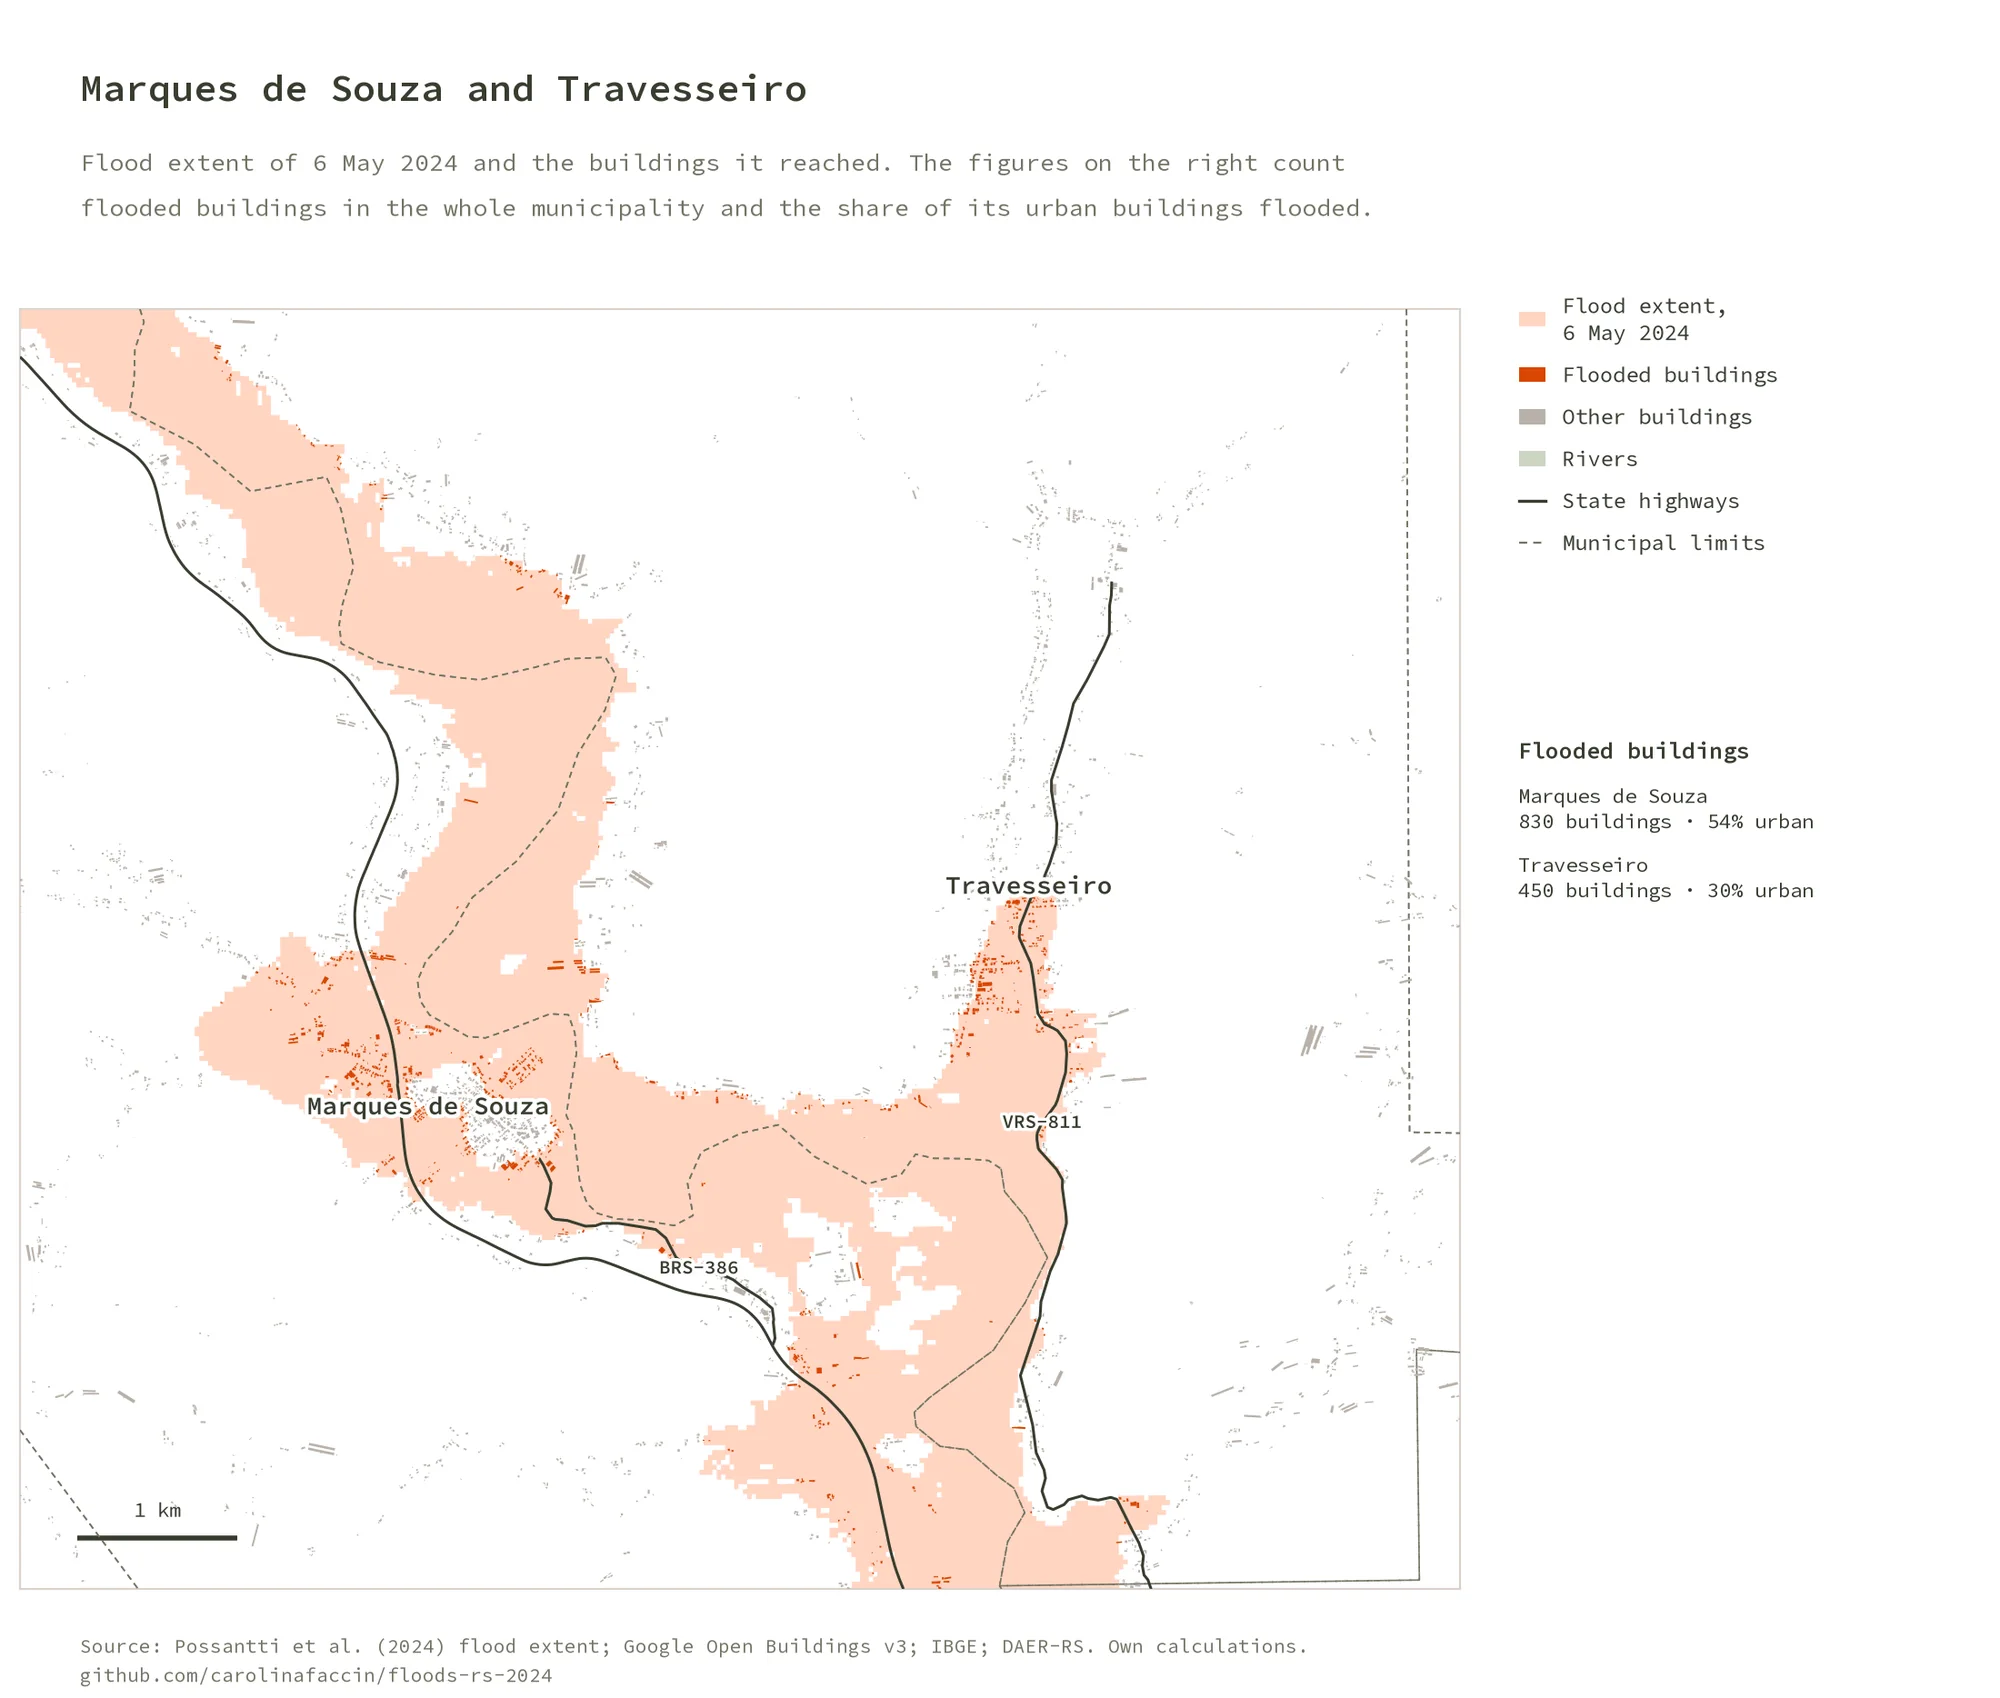
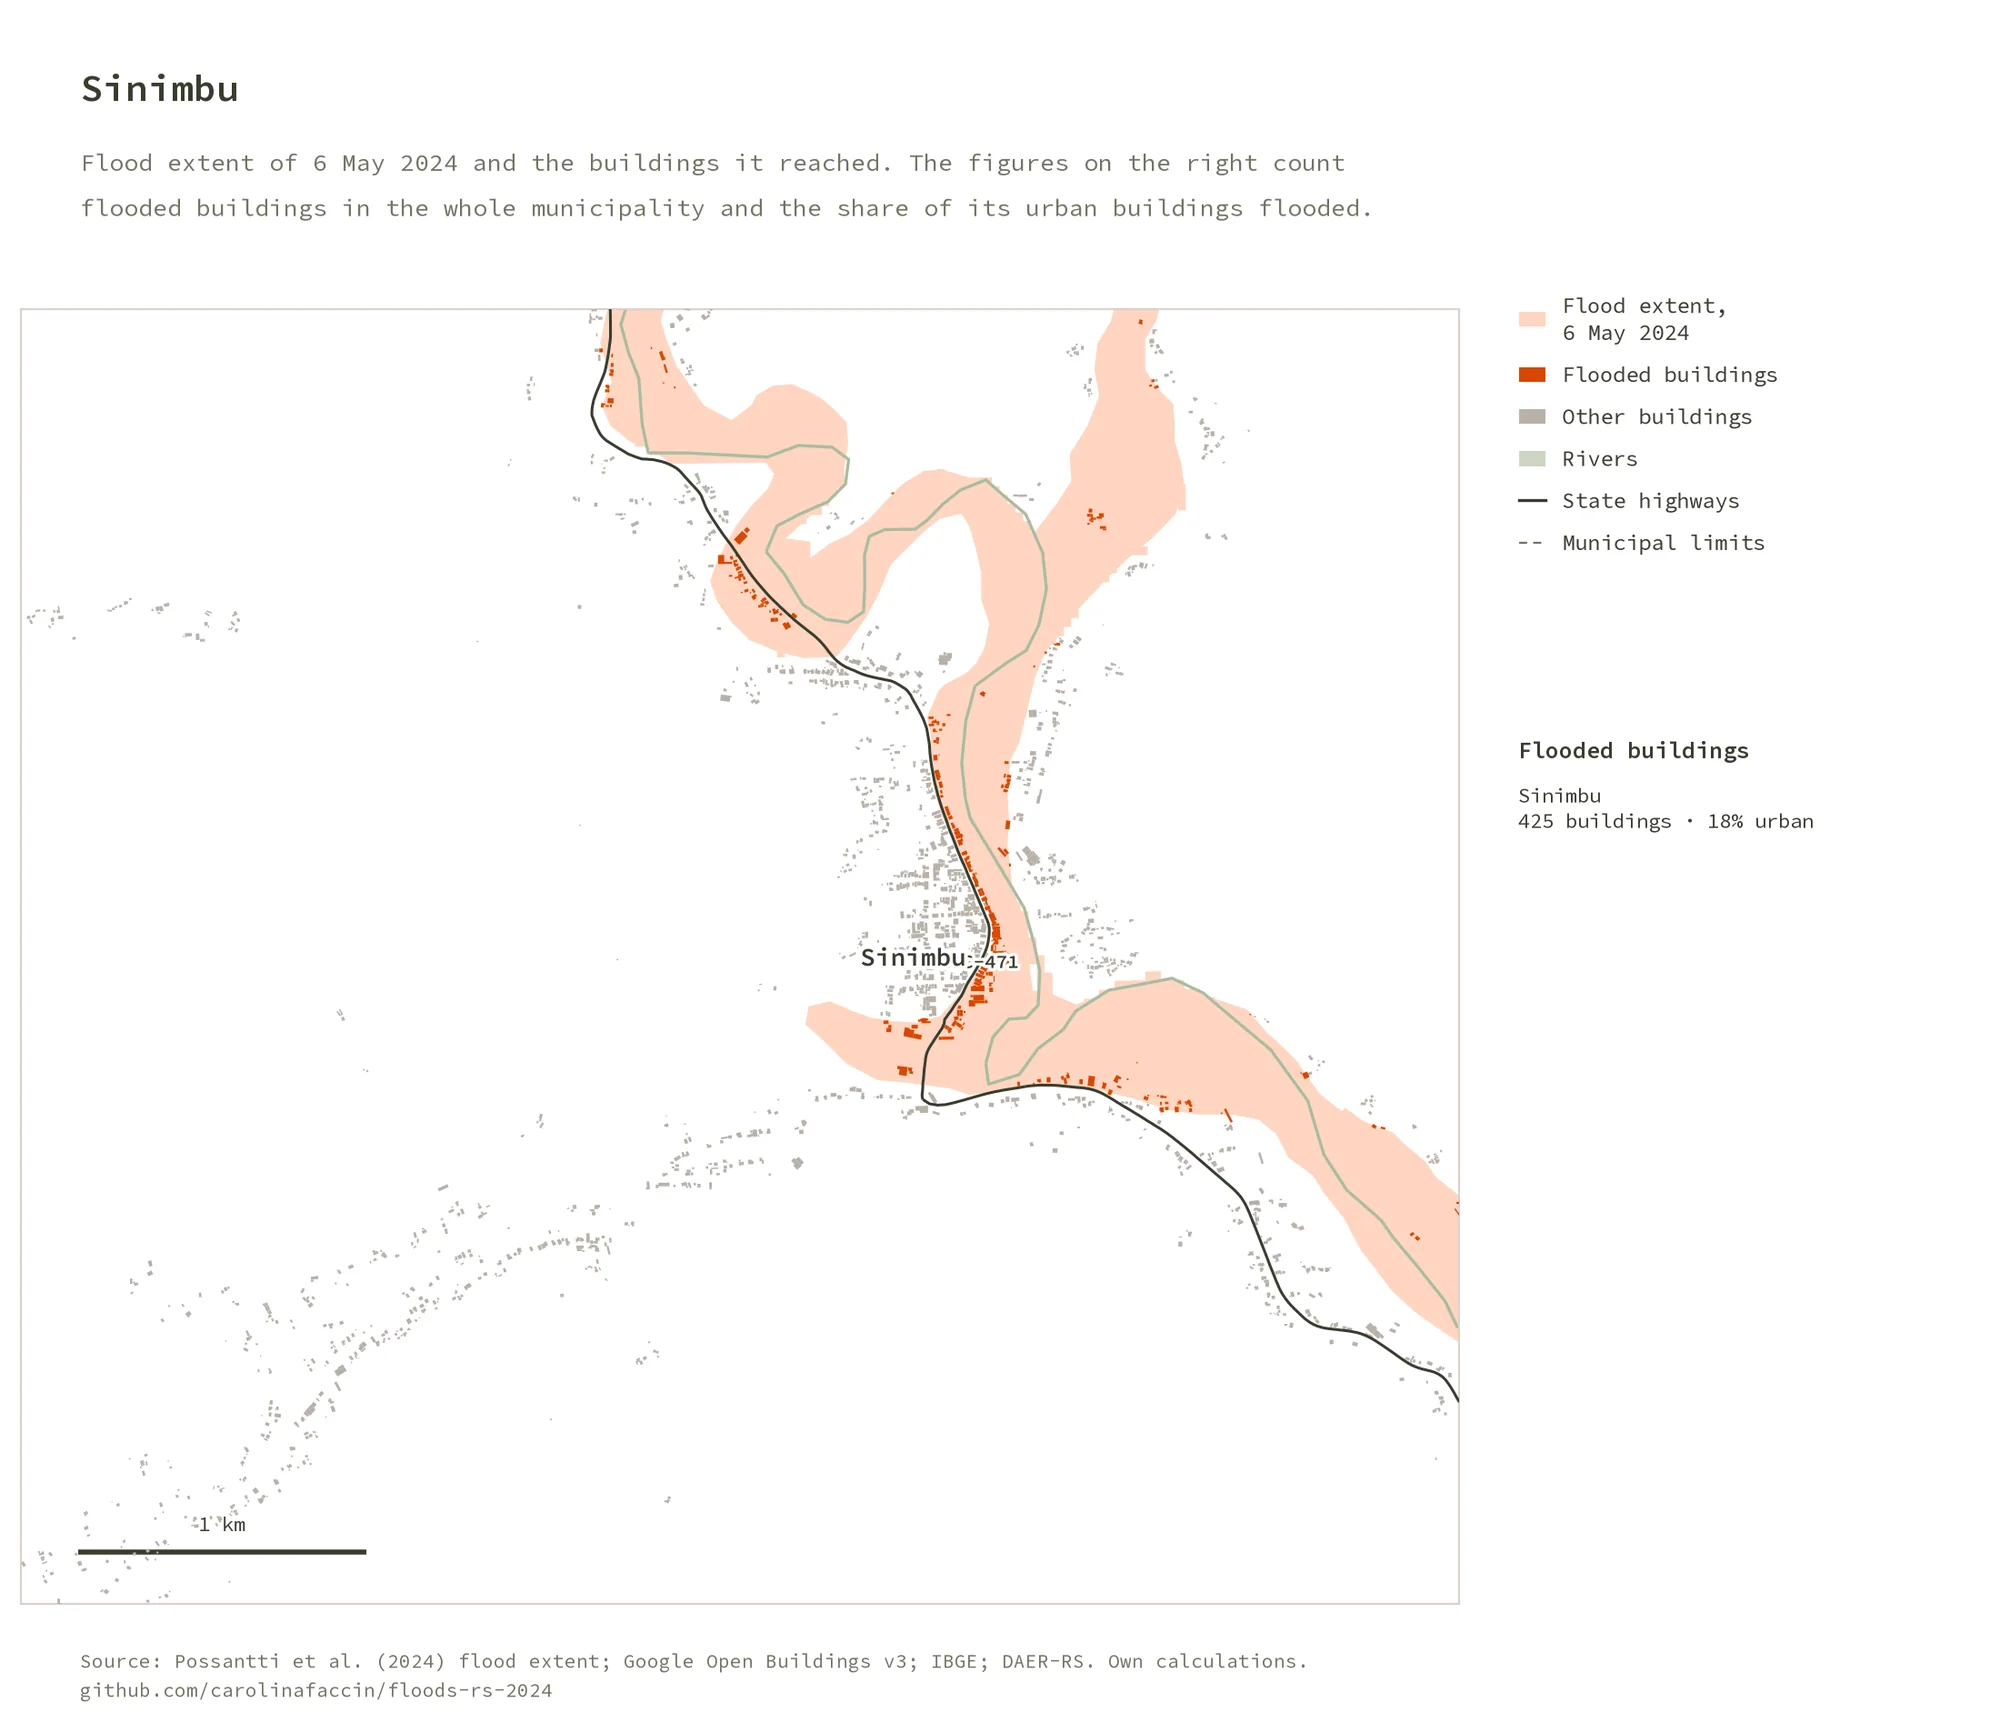
Buildings inside the flood extent, mapped city by city
- Report
Diagnosis and recommendations for public managers
Results#
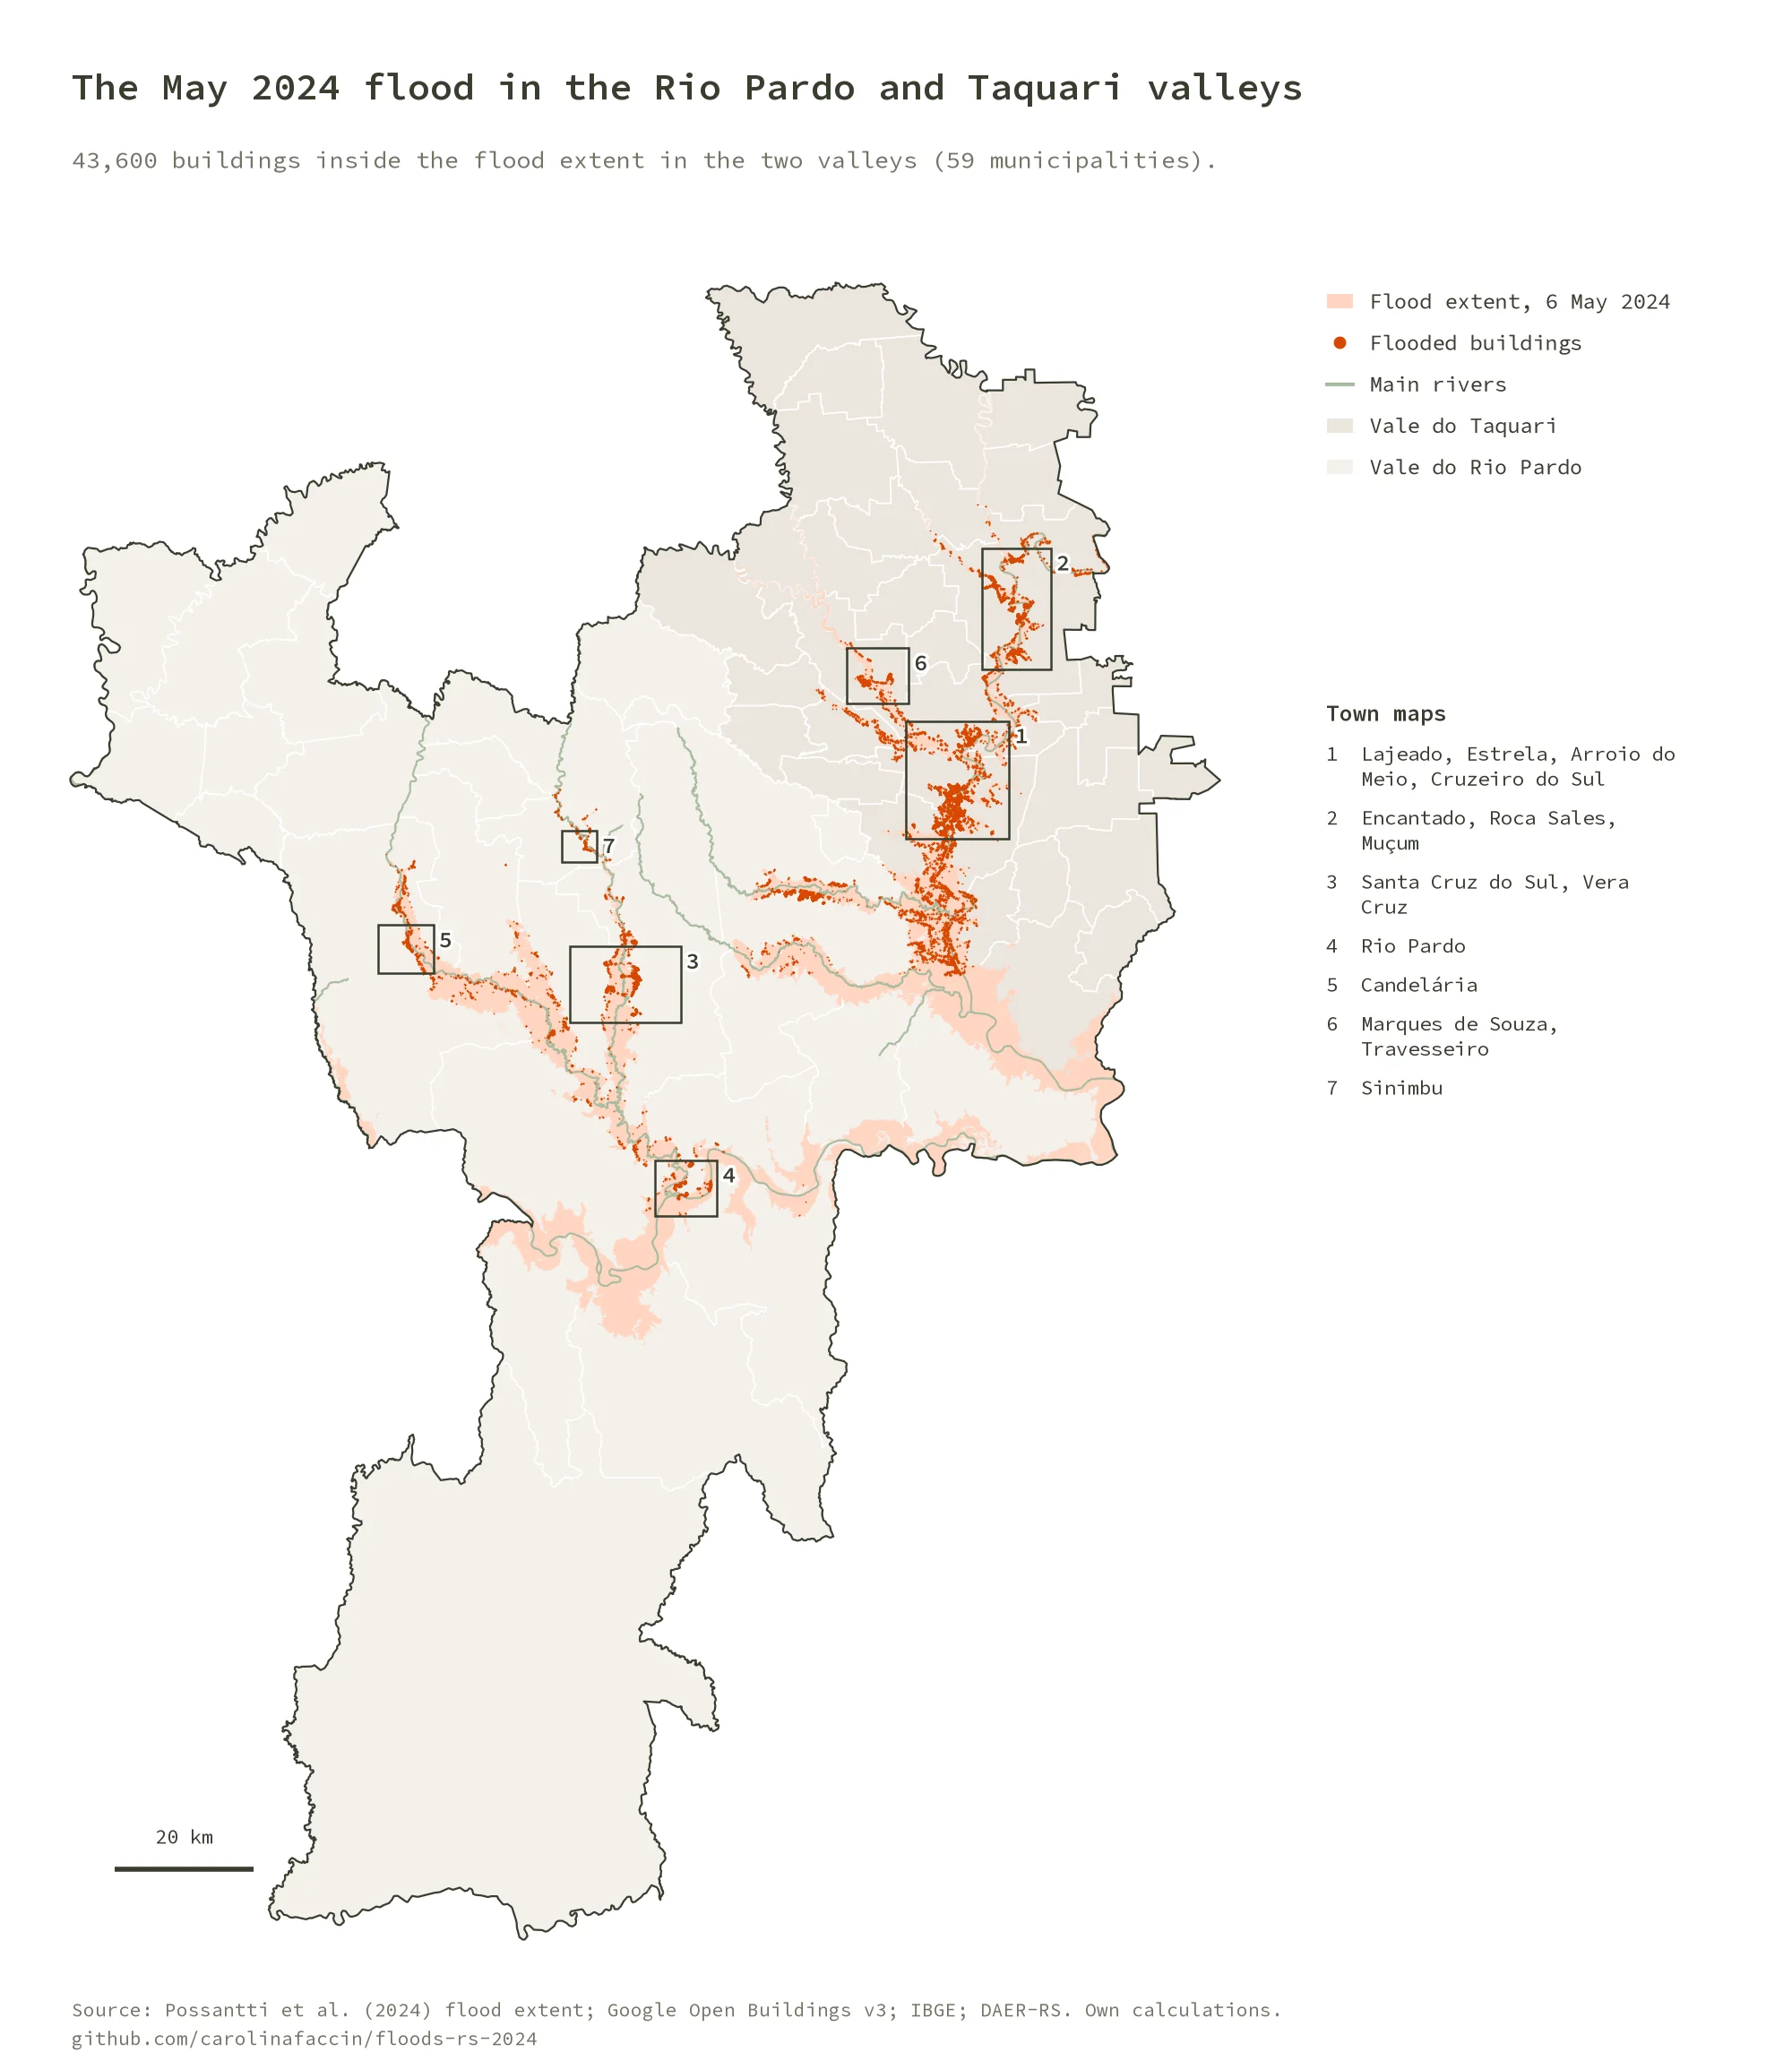
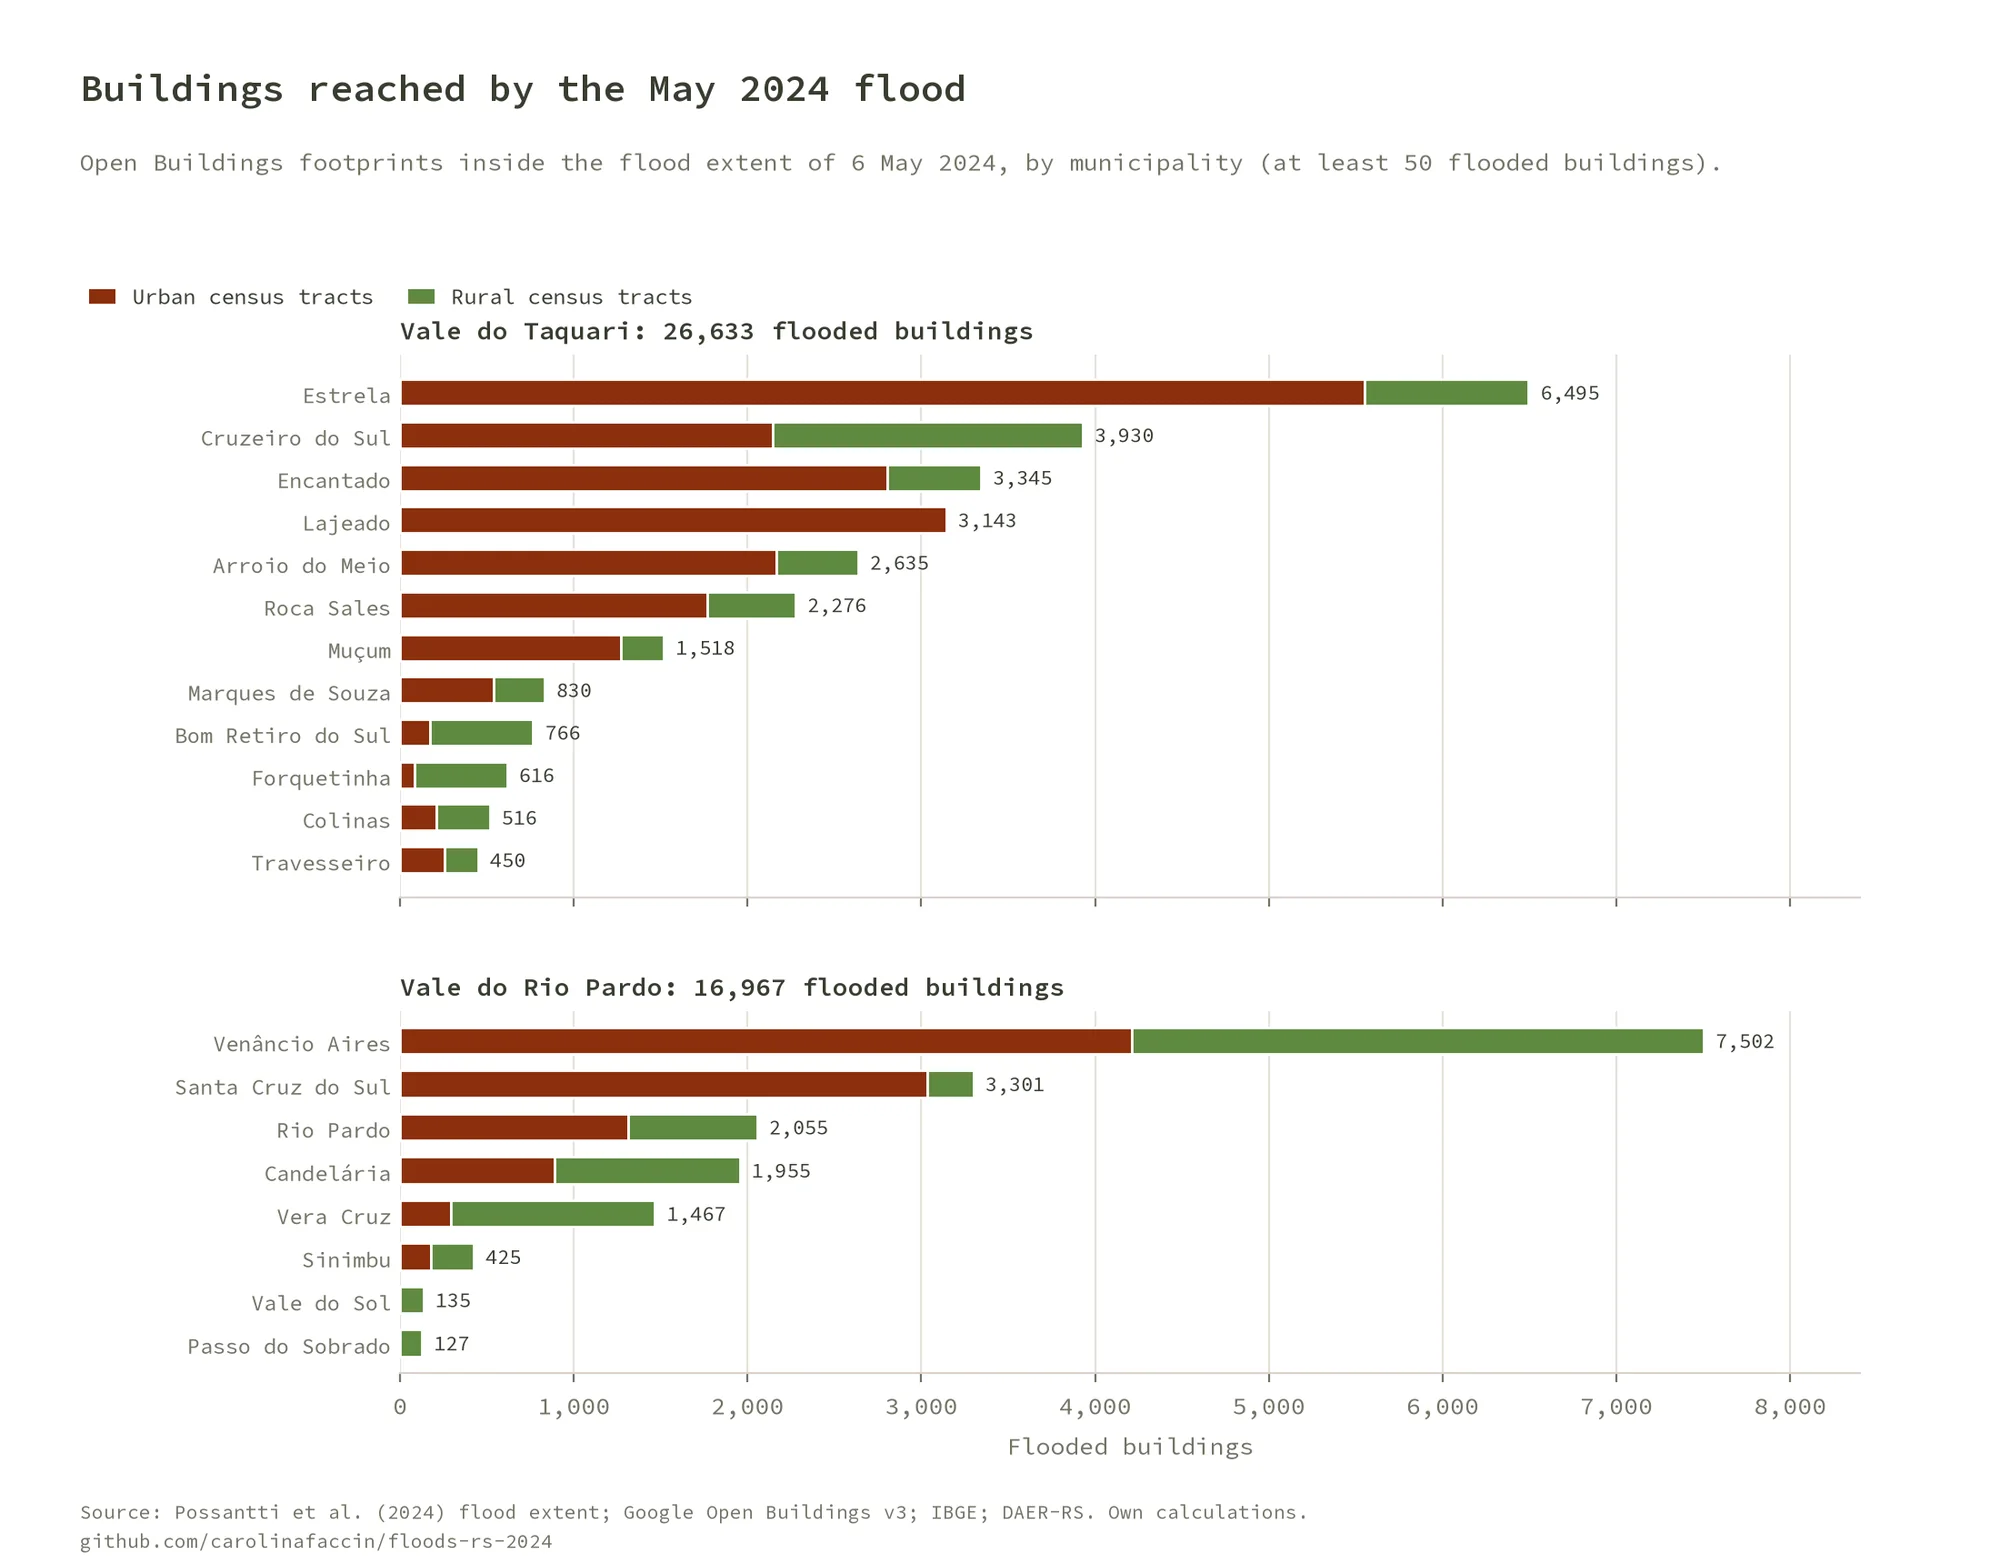
- 43,600 buildings were reached by the floods in the two valleys: 26,633 in the Taquari valley and 16,967 in the Rio Pardo valley, 8.7% of all buildings and 11.6% of those in urban census tracts.
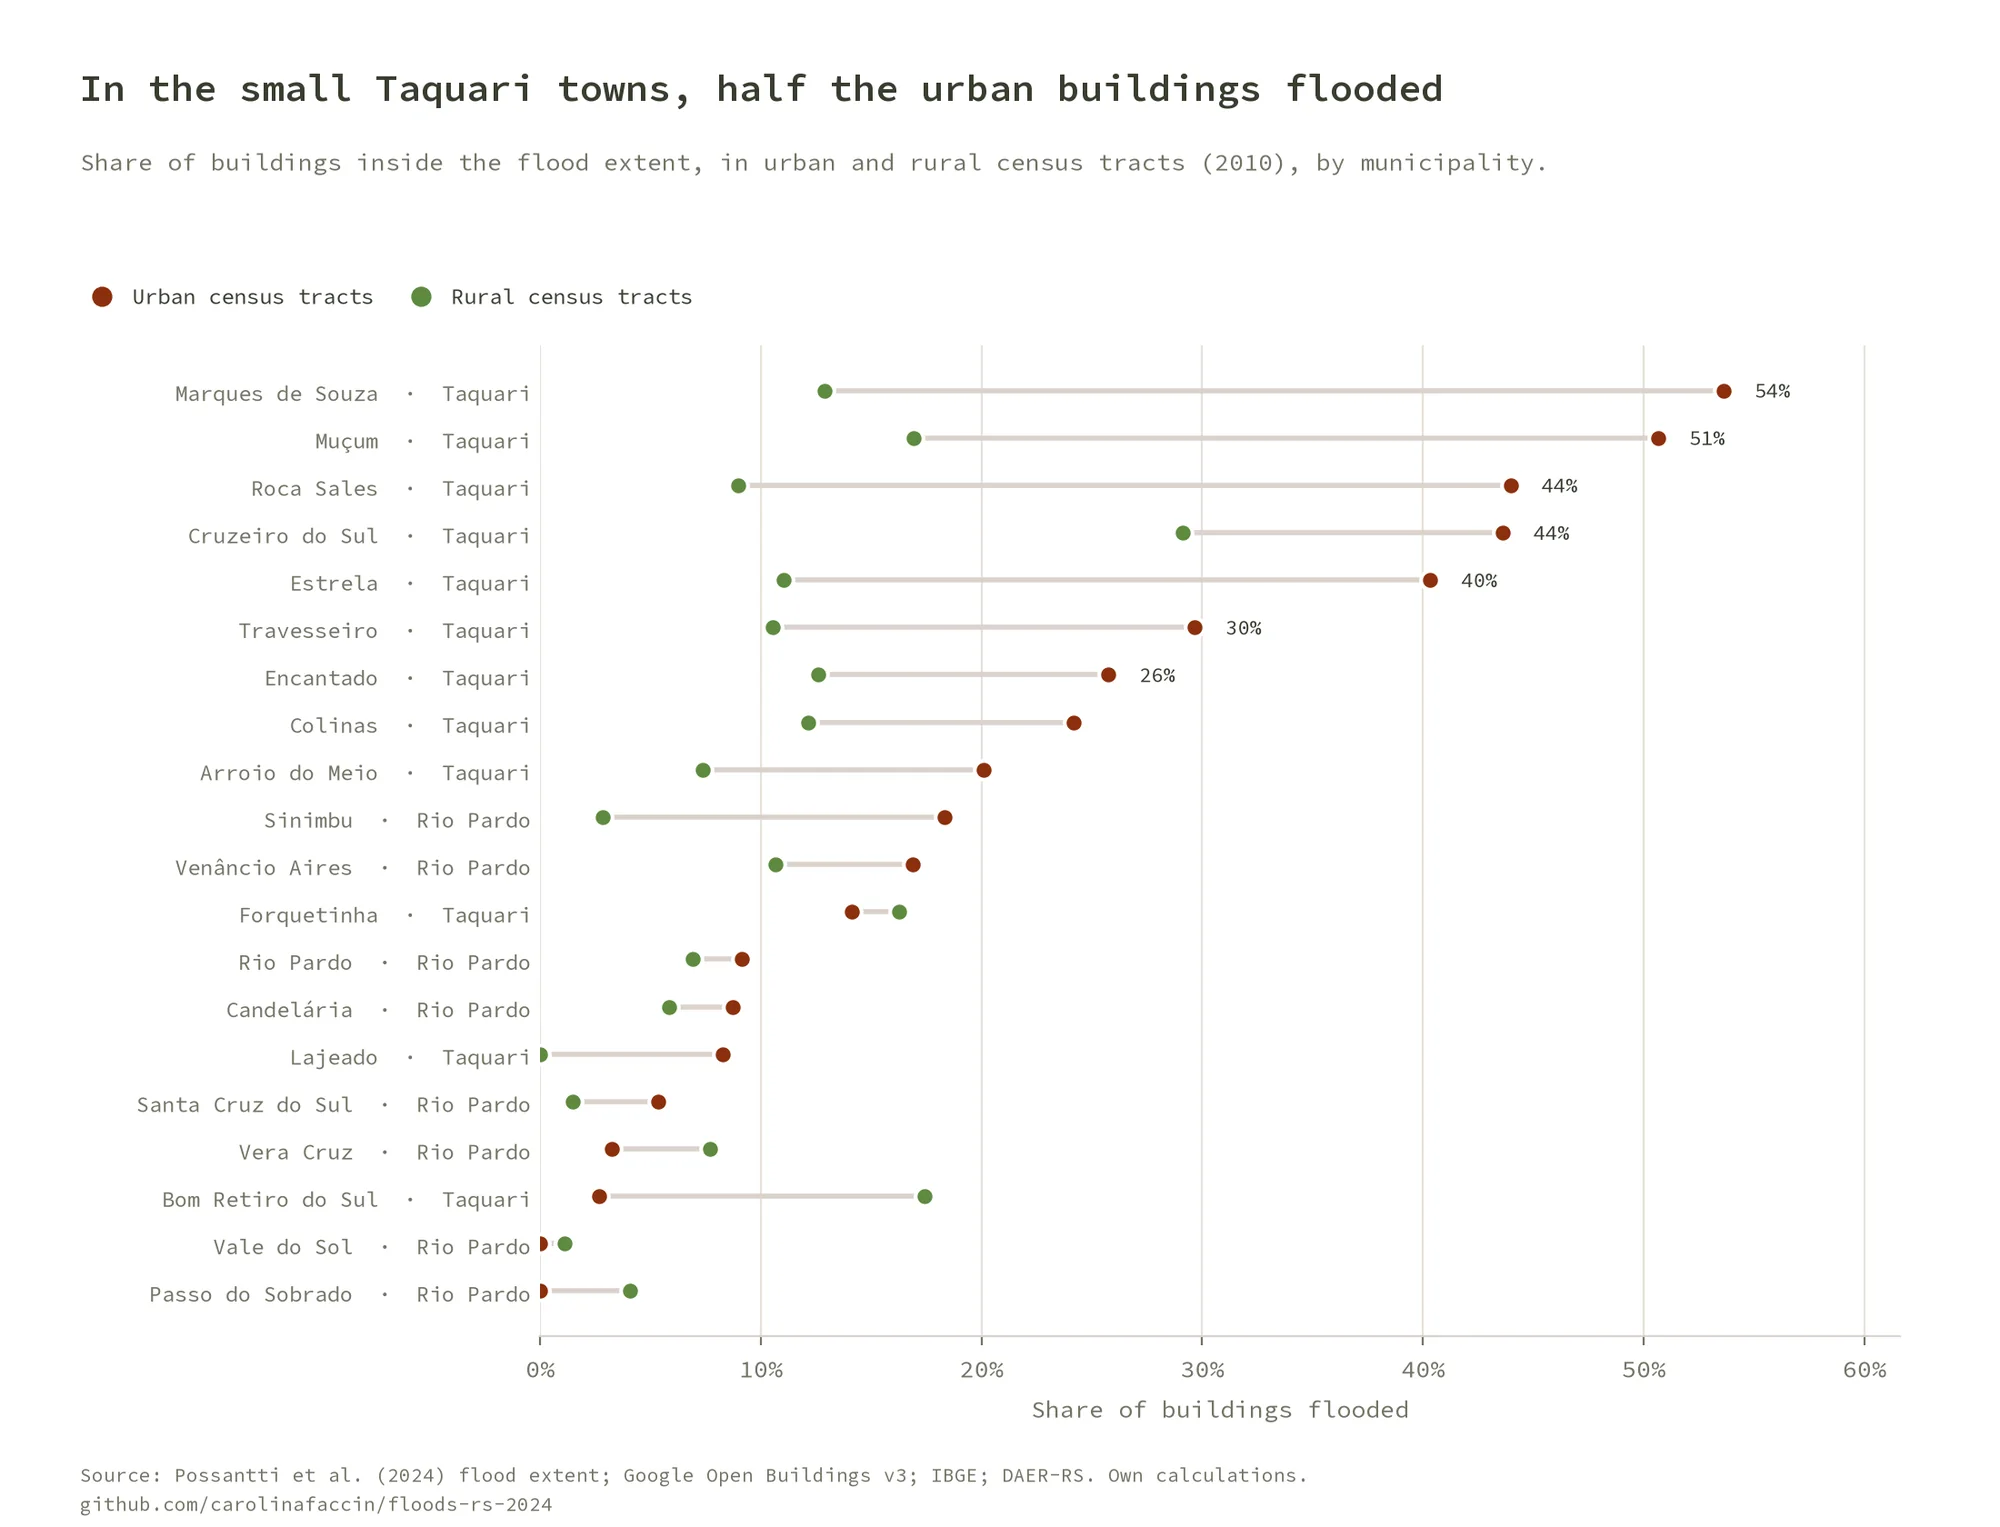
- Small towns were hit hardest: the flood reached about half the urban buildings of Marques de Souza (54%) and Muçum (51%), and more than 40% in Roca Sales, Cruzeiro do Sul and Estrela.
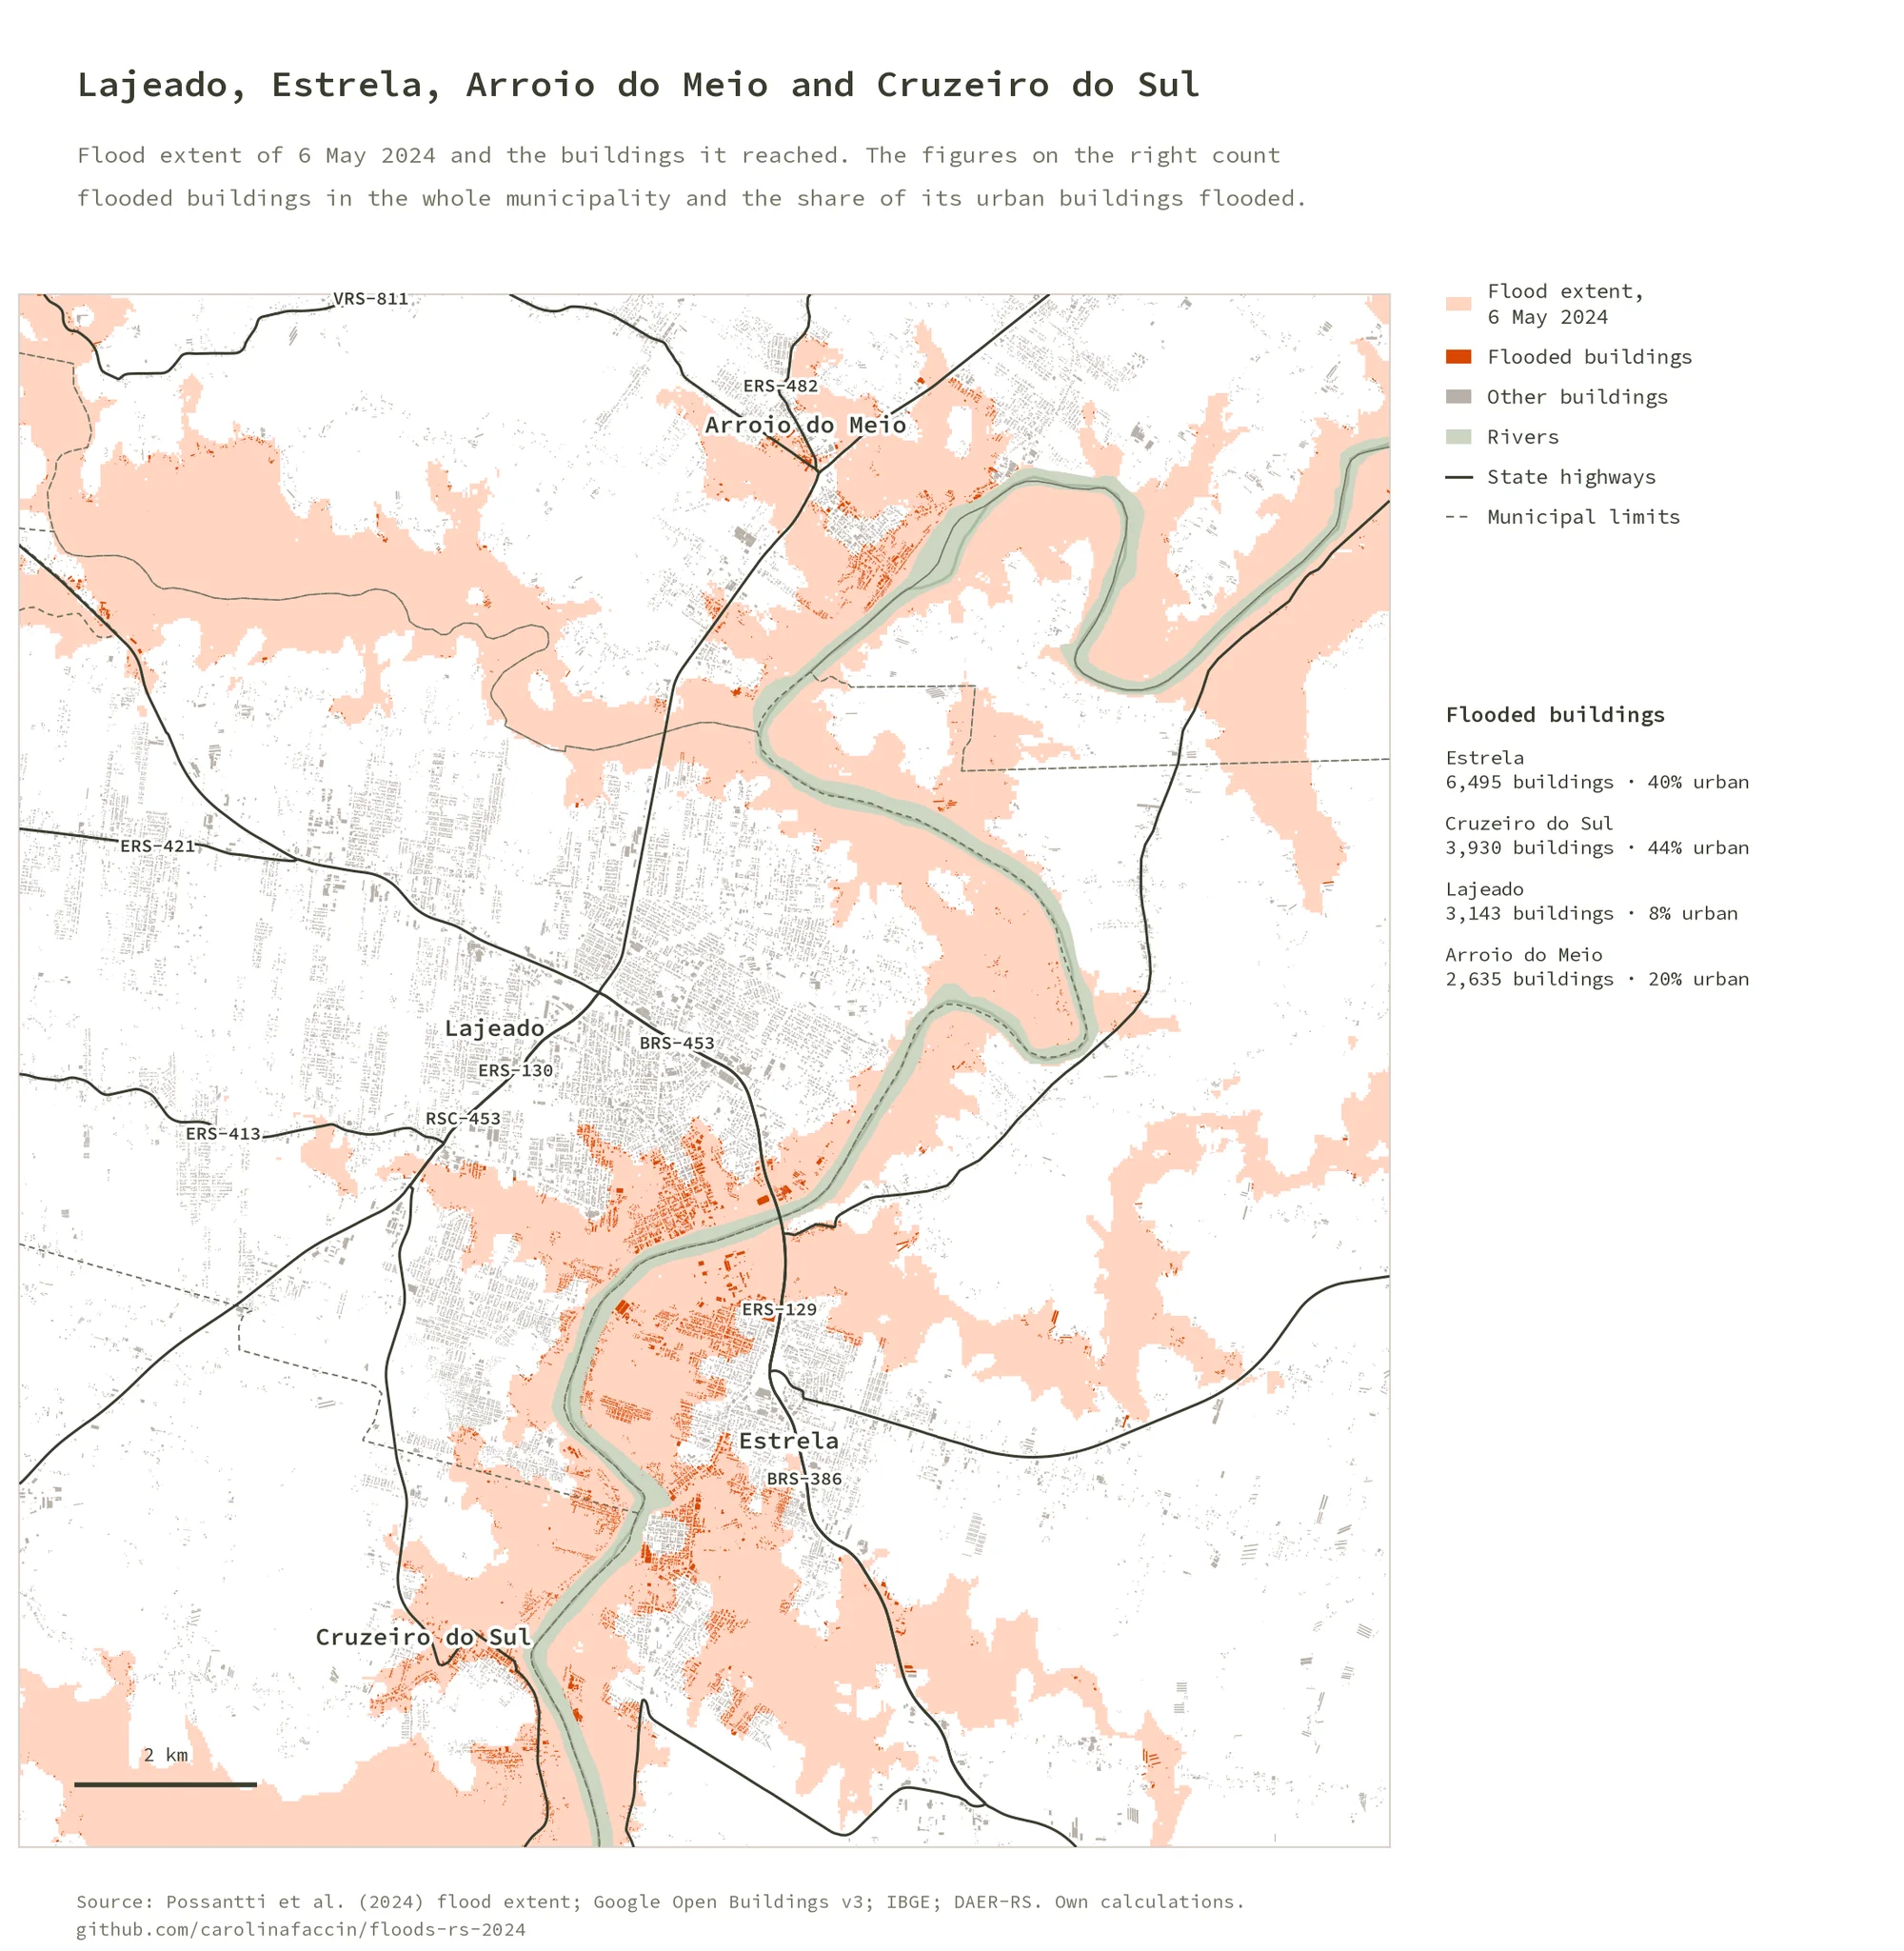
- City-scale maps for urban areas in both valleys (including Santa Cruz do Sul, Rio Pardo, Candelária, Lajeado, Estrela, Encantado, Muçum and Roca Sales) showing where flooded buildings concentrate.
- The analysis exposed fragile infrastructure (blocked roads, damaged bridges) and planning instruments that did not account for flood risk.
Impact#
The technical report was delivered directly to public managers through COREDE Vale do Rio Pardo, supporting emergency decision-making and the discussion on climate adaptation. The work was later published as a peer-reviewed article, which stresses that small cities need institutional support from state and federal governments and multi-scale policy coordination.
Read the paper (EN/PT): Detoni, Faccin, Silveira, Rorato & Machado (2025), Extreme weather events and their socio-spatial impacts on small cities in Rio Grande do Sul, Brazil.
I later rebuilt the analysis as an open, reproducible Python pipeline that reproduces the counts published in the paper: code and figures on GitHub.
Figures#
Produced by the open pipeline above.