- Period
- 2020–2022
- Location
- Rio Grande do Sul and the Porto Alegre Metropolitan Region, Brazil
- Partners
- ObservaDR/COVID-19 project (more than 20 researchers); PROPUR/UFRGS
- My role
- Built and maintained the spatial database for the 497 municipalities, ran the analyses and produced the maps; lead author of the metropolitan study.
- Data
- State and municipal health secretariats · Brasil.io open data · IBGE (Census 2010, REGIC 2018) · RAIS (2018) · MAPA establishment registry · FEPAM
- Tools & methods
- PostgreSQL/PostGIS · SQL · QGIS · Python · Excel · Adobe Illustrator
The challenge#
In 2020, case counts were published daily for each of the state’s 497 municipalities, but raw numbers did not explain why the virus moved the way it did. Researchers suspected the answer lay in how cities are connected: commuting, access to hospitals and the location of large workplaces.
Approach#
As part of the ObservaDR/COVID-19 project, I built a spatial database that joined daily epidemiological data to the structure of the urban network. We then applied the same approach in more detail to the Porto Alegre Metropolitan Region, the state’s most populated area.
- Case data
Daily confirmed cases and deaths (state health secretariat, Brasil.io)
- Database
PostGIS database covering all 497 municipalities
- Context layers
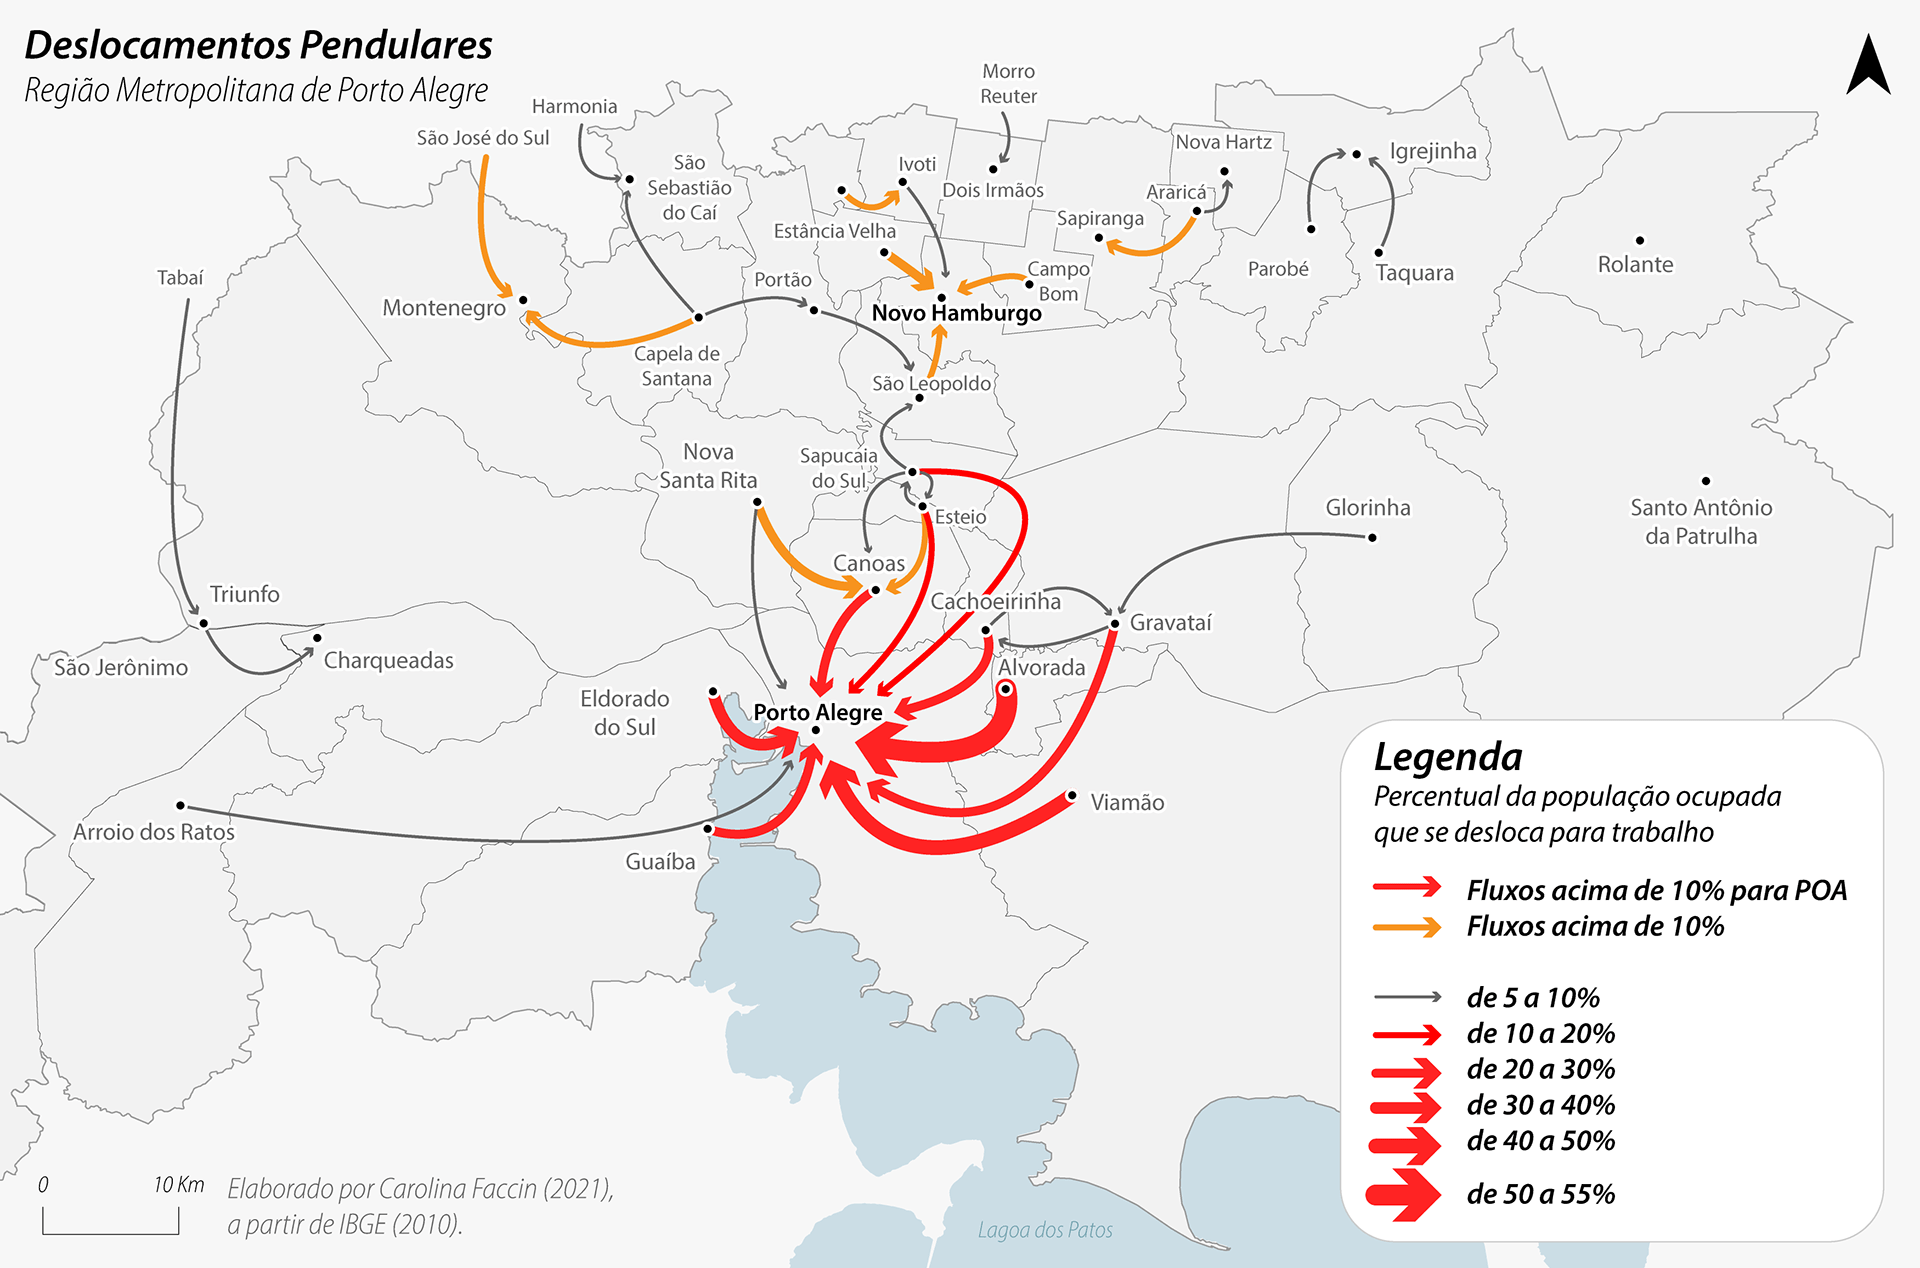
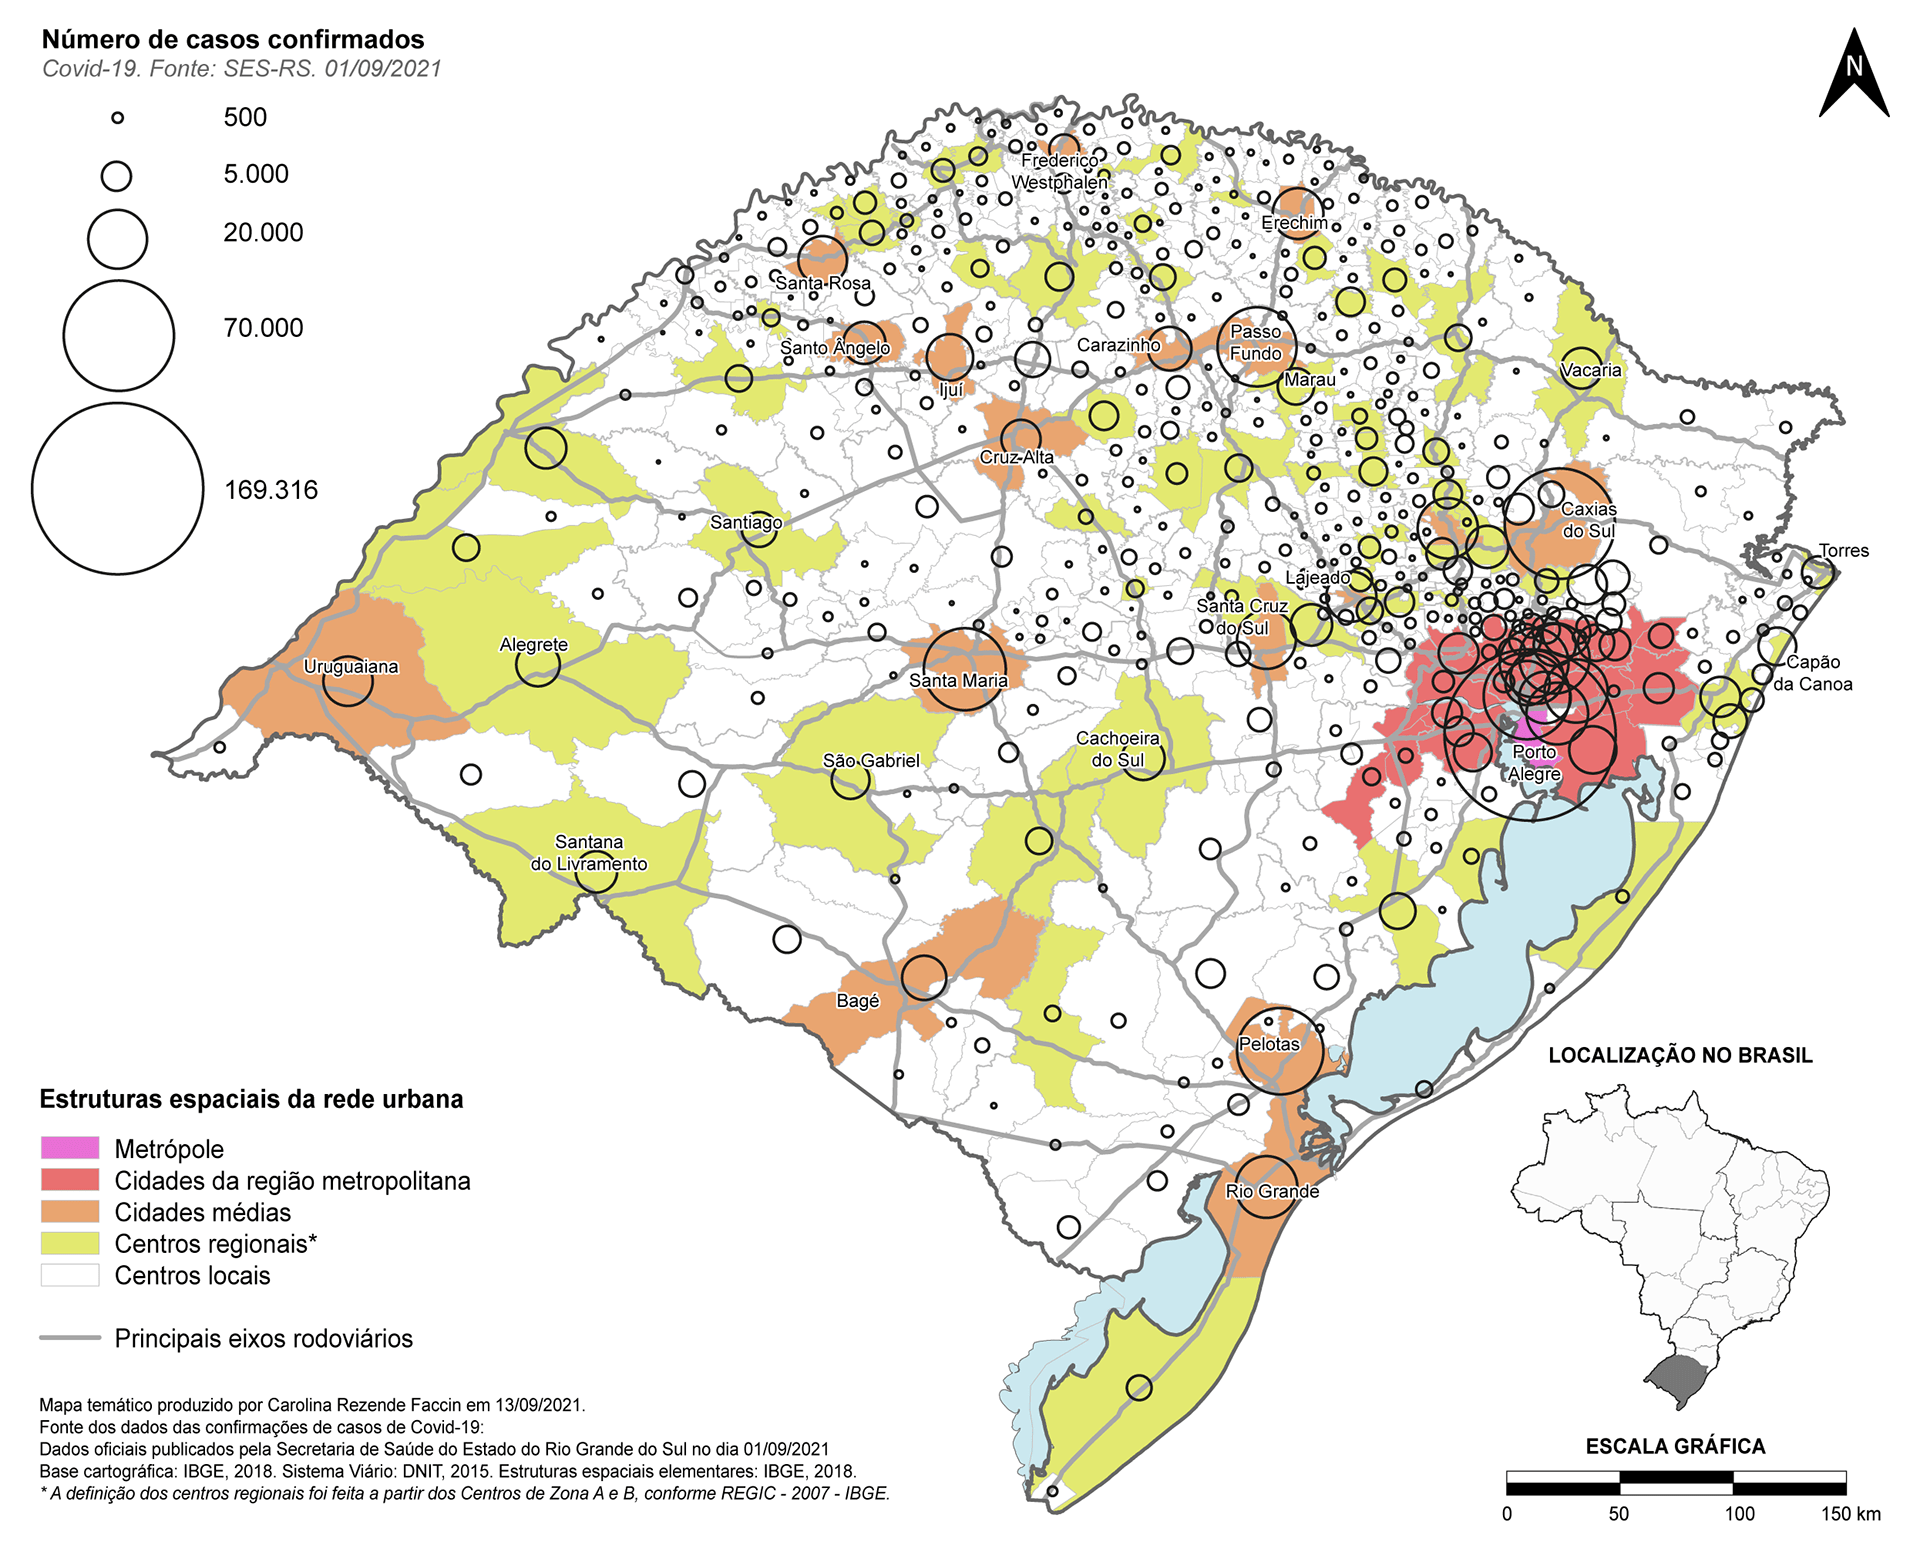
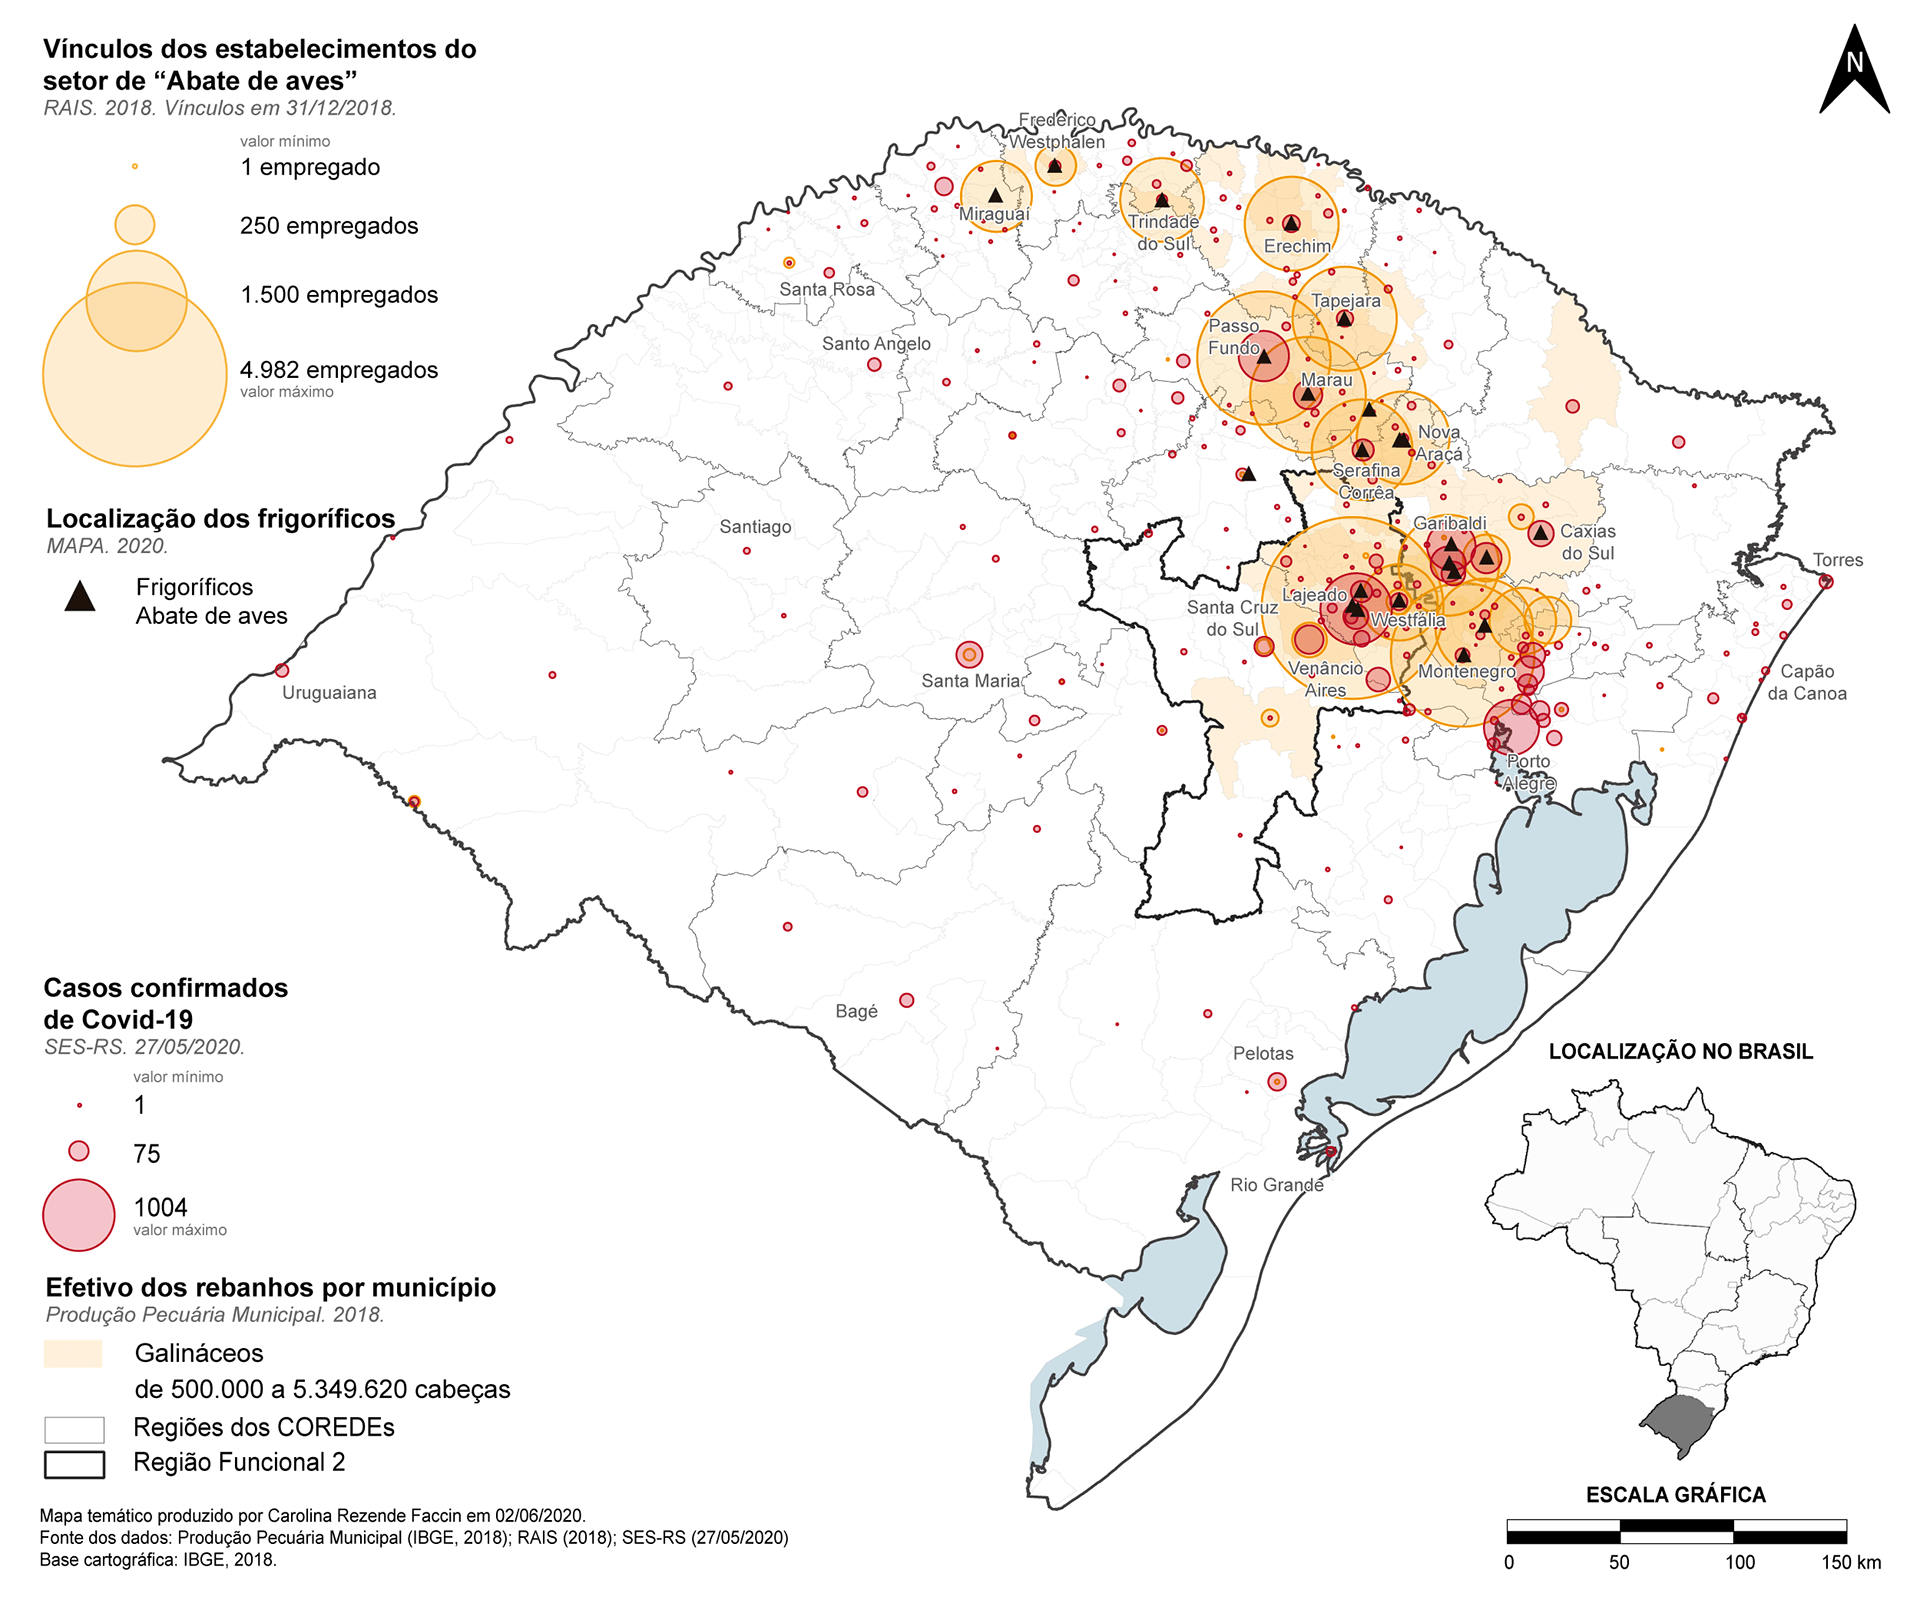
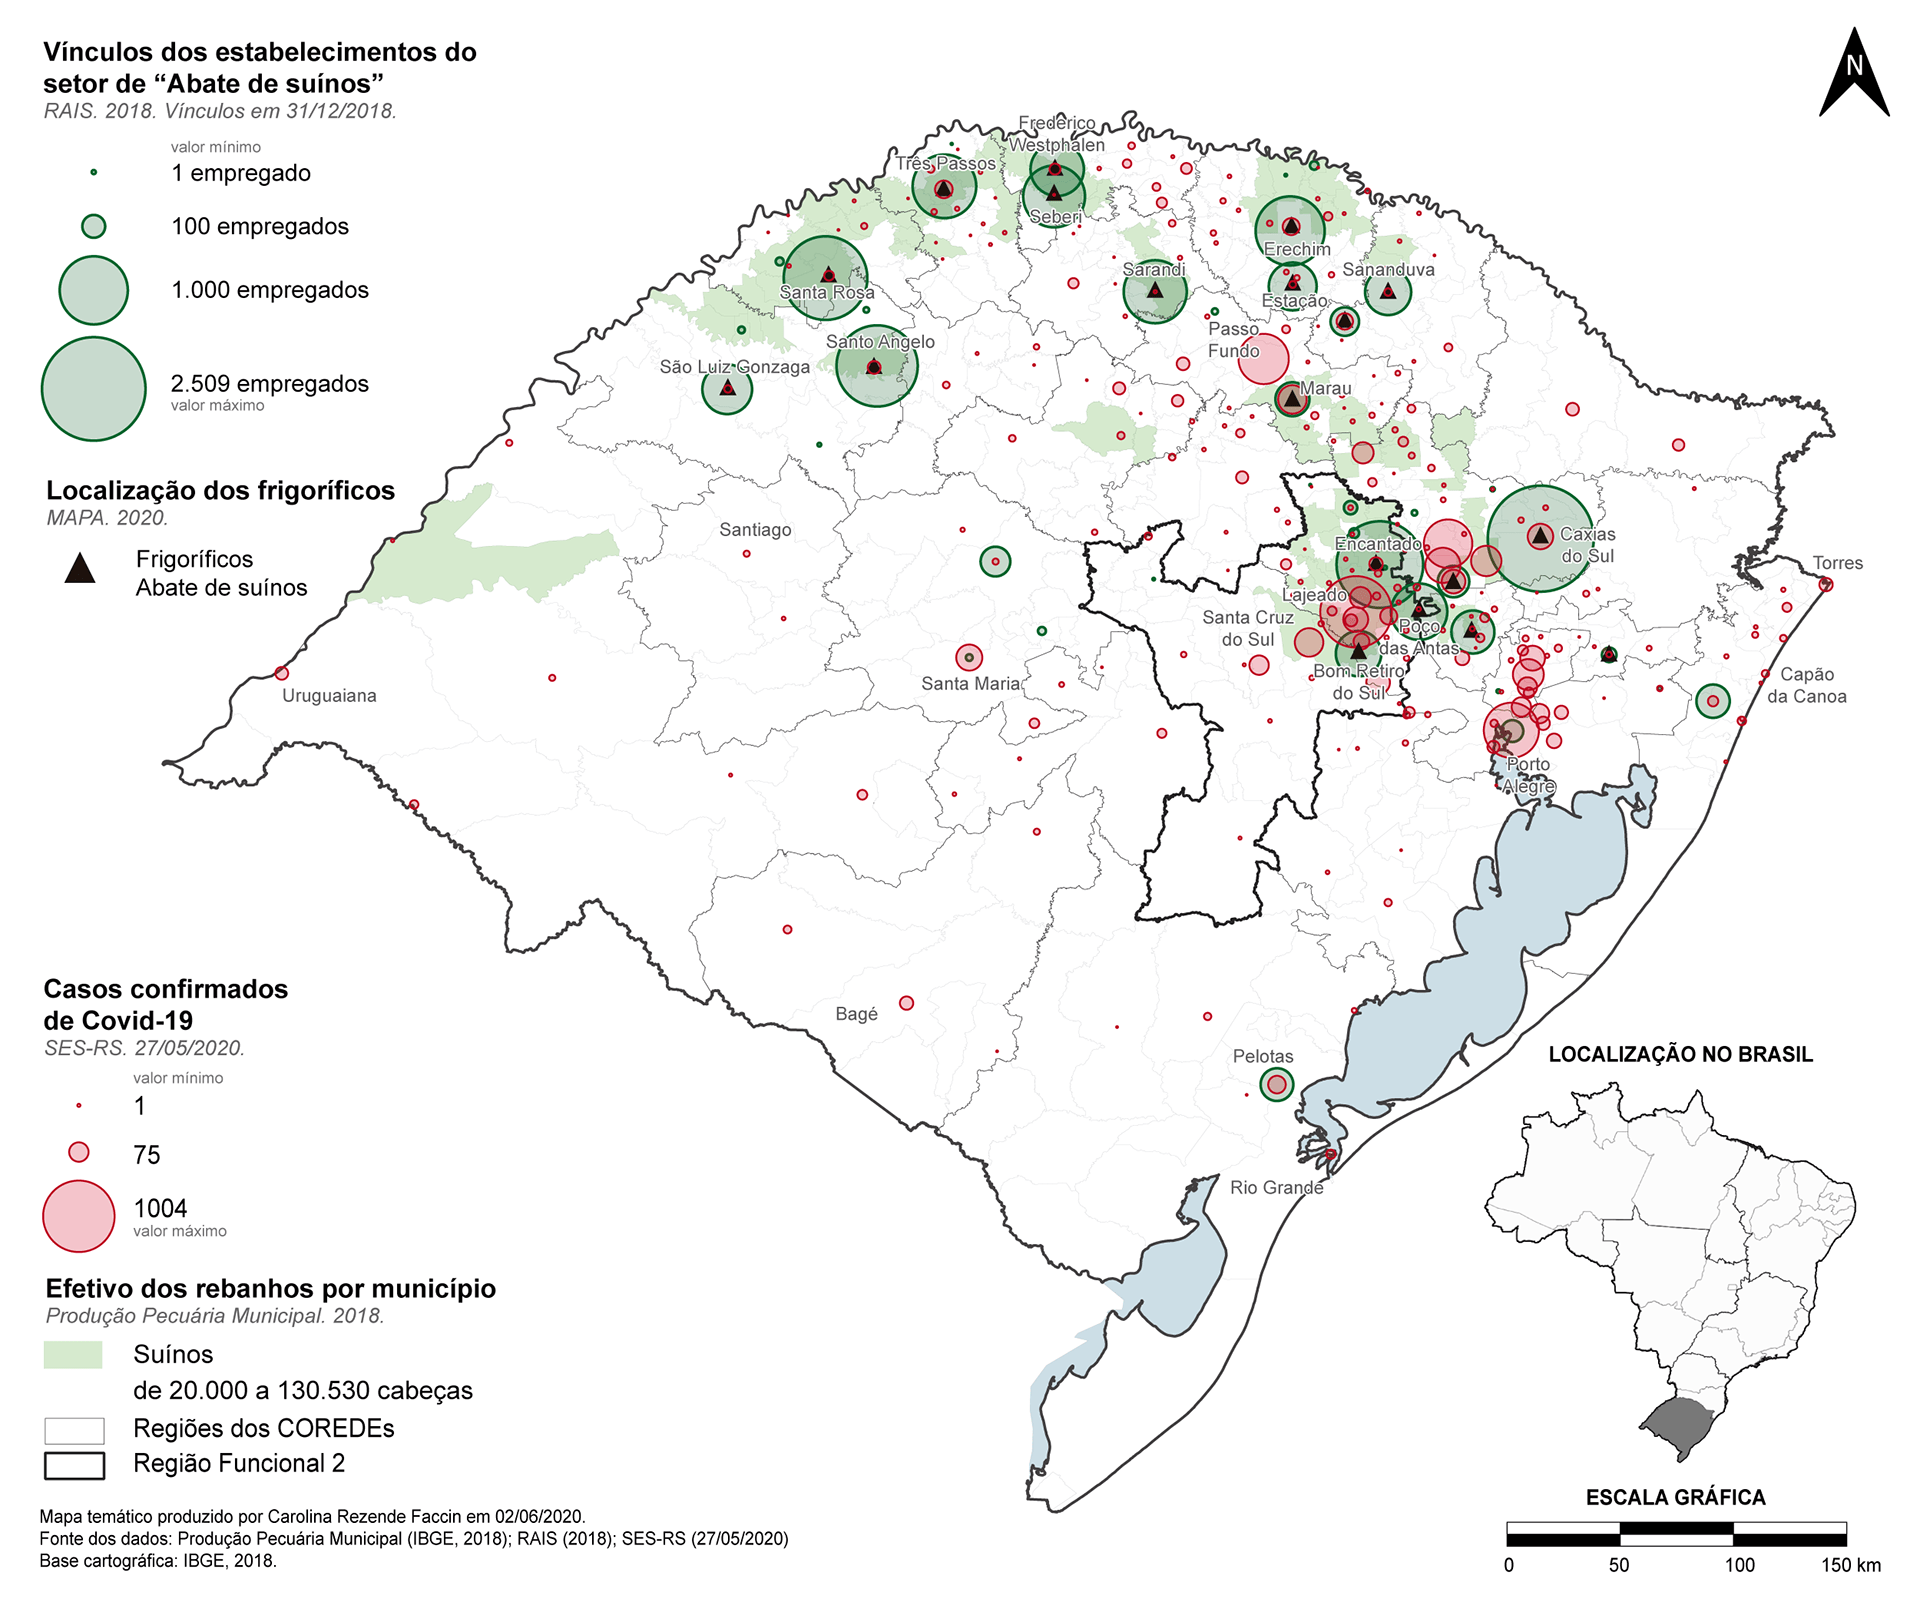
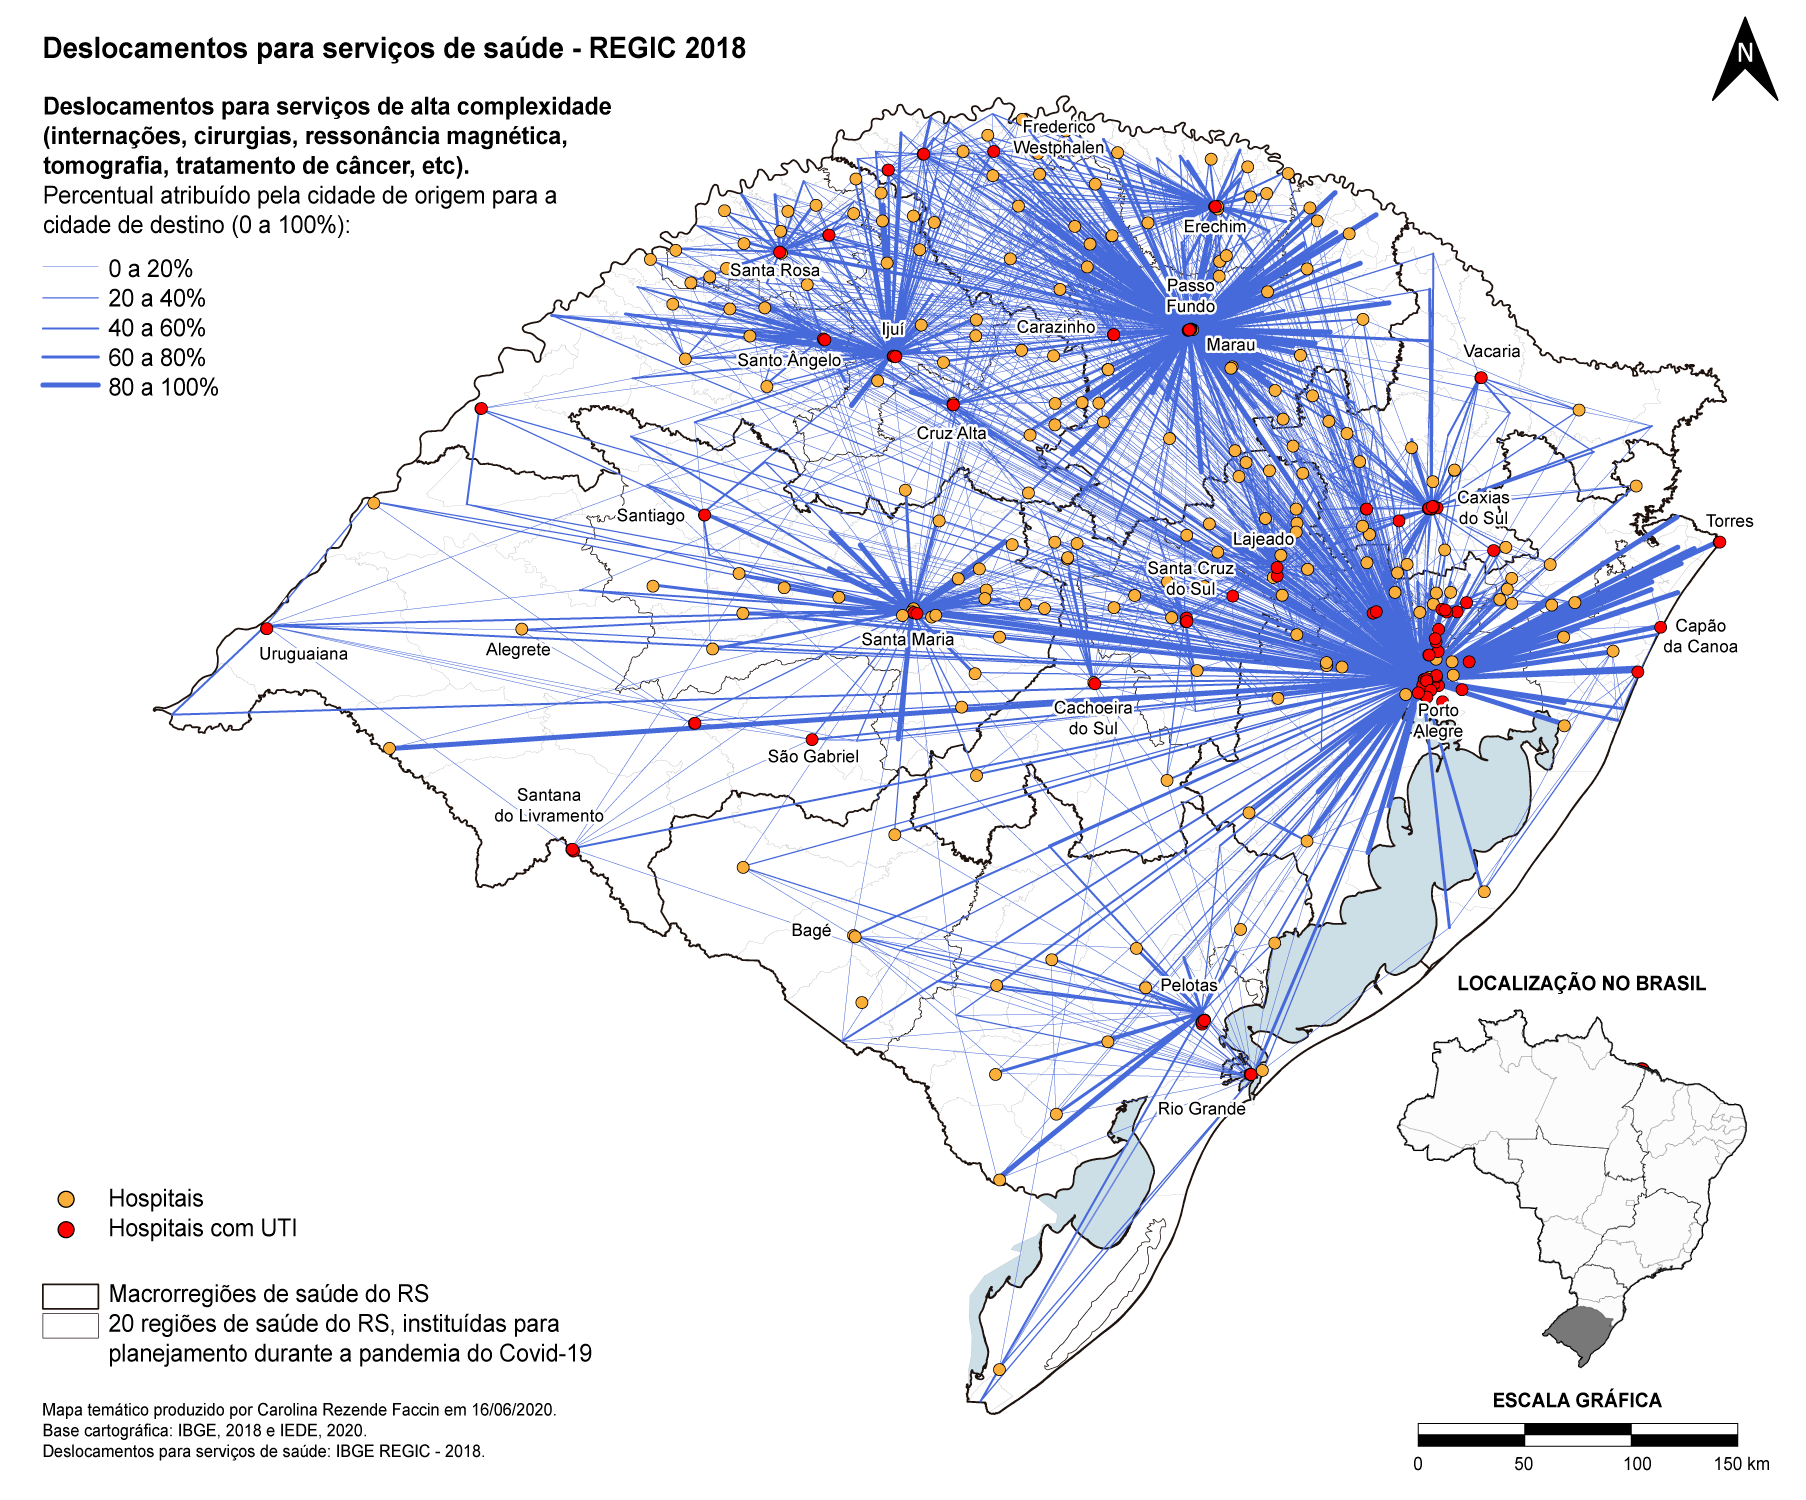
Commuting, urban hierarchy, hospital access, meatpacking plants, housing conditions
- Public output
Maps for the public and peer-reviewed articles
Results#
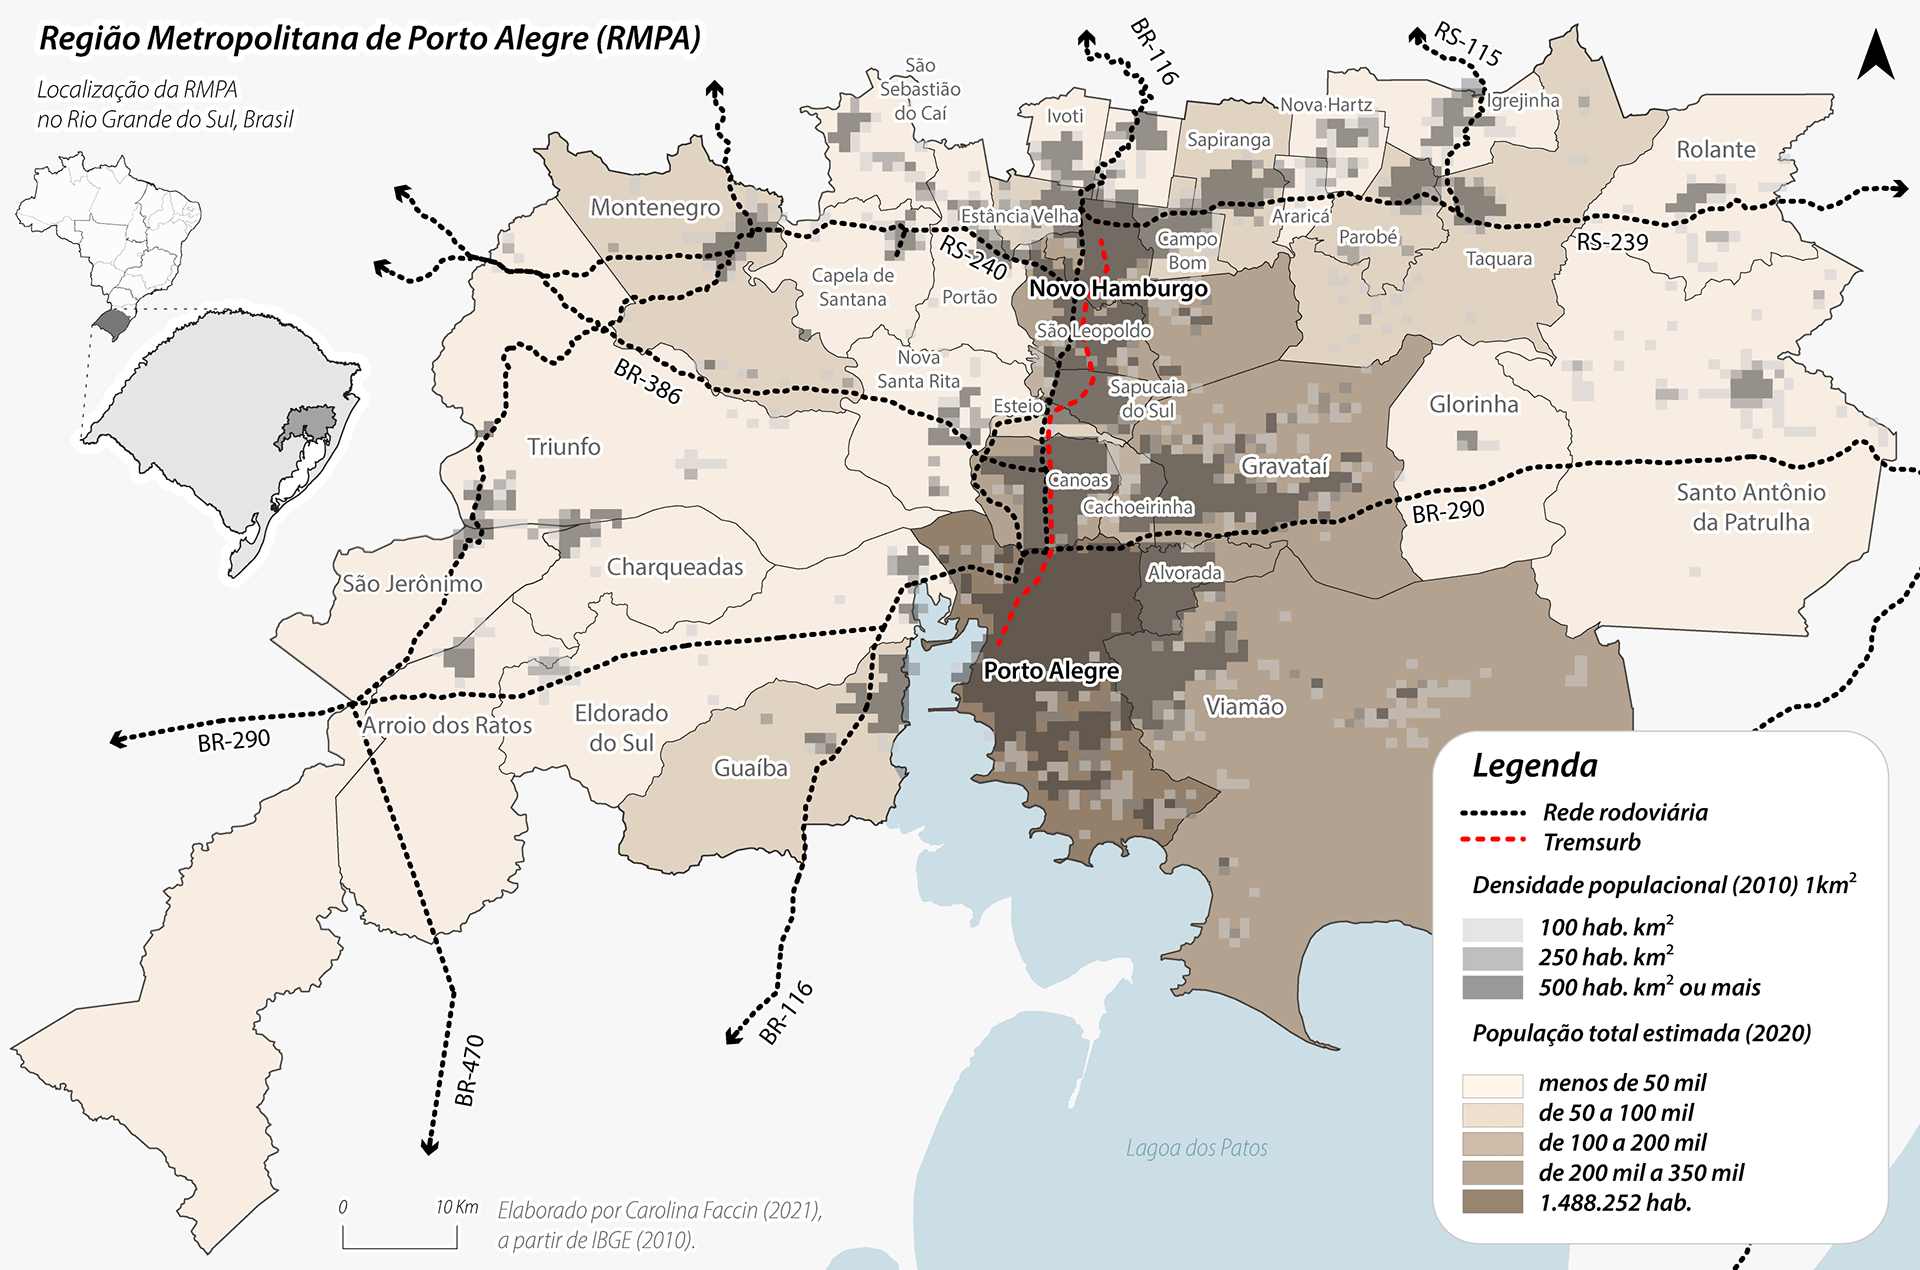
- In the metropolitan region, Porto Alegre, Canoas and Novo Hamburgo concentrated 56.3% of confirmed cases by April 2021. The virus spread along the BR-116 highway and the Trensurb rail corridor, the main commuting axes.
- Mortality was higher in shoe-manufacturing municipalities, and municipalities with inadequate household infrastructure had higher transmission.
- In the interior, cases concentrated in medium-sized cities, which are also regional health hubs, and vaccination clearly reduced deaths over the two years analyzed.
- In Santa Cruz do Sul, the state’s controlled-distancing model reduced circulation and cases until December 2020, but did not prevent exponential growth in 2021.
Why it matters#
The project showed that pandemic response depends on urban planning: mobility, regional health networks and infrastructure inequality shaped who got sick. It also showed that open data and a well-structured spatial database can inform the public quickly during a crisis.
Publications (PT):
- Faccin et al. (2022): one year of the pandemic in the Porto Alegre Metropolitan Region.
- Silveira, Cazarotto, Faccin & Vogt (2020): Covid-19 dispersion in the Vales Region and the medium-sized cities of Santa Cruz do Sul and Lajeado.
- Stavizki Junior, Faccin & Silva (2022): the controlled-distancing model in Santa Cruz do Sul.
- Giacometti & Faccin (2024): two years of the pandemic in the Vales Region.
Maps#