- Period
- 2025–2026
- Location
- Osório, Tramandaí and Imbé, North Coast of Rio Grande do Sul, Brazil
- Partners
- Co-authors Juliana Lombard de Souza and Guilherme Kruger Dalcin
- My role
- Lead author: research design, data processing in Python, spatial analysis and maps.
- Data
- MapBiomas land use and land cover (1985–2023) · IBGE demographic censuses (1991–2022) · Google Open Buildings
- Tools & methods
- Python (GeoPandas, Matplotlib) · Land-cover change analysis · Reproducible pipeline
The challenge#
The North Coast is one of the fastest-growing parts of the state. Seasonal tourism, second homes and permanent migration have pushed cities into a near-continuous strip along the shoreline. The question was not just how much the cities grew, but over what: dunes, beach vegetation (restinga) and wetlands that protect the coast and are hard to recover once built over.
Approach#
I processed 39 years of annual land-cover maps for three neighboring municipalities, each with a different role: Osório (regional hub), Tramandaí (main tourist center) and Imbé (seasonal growth). Land-cover change was combined with census population trends.
- Time series
MapBiomas annual land cover, 1985–2023
- Processing
Python pipeline: reclassify, clip by municipality, compute area per class and year
- Change analysis
1985 vs. 2023 maps, class-by-class trends, population growth (IBGE)
- Findings
Where and how urban growth advanced over sensitive ecosystems
Results#
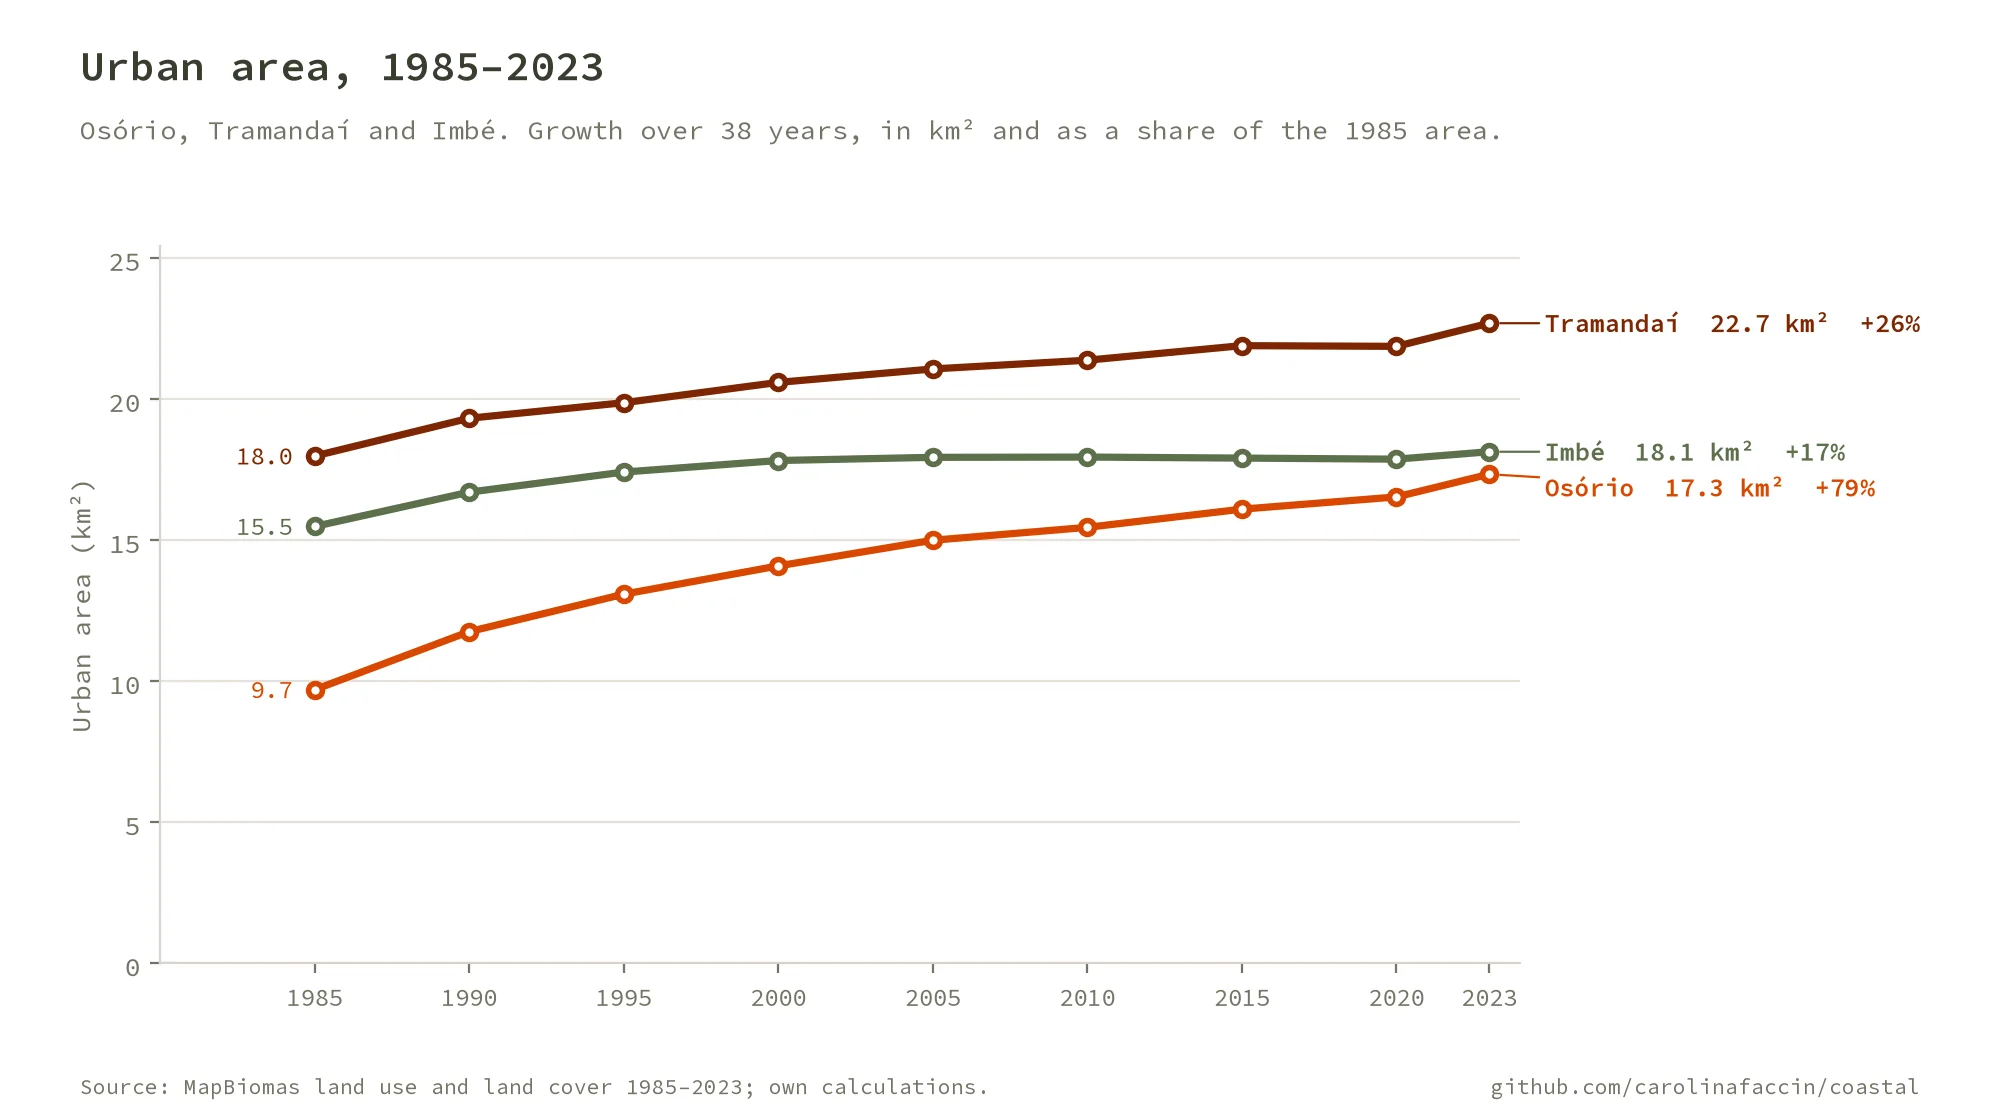
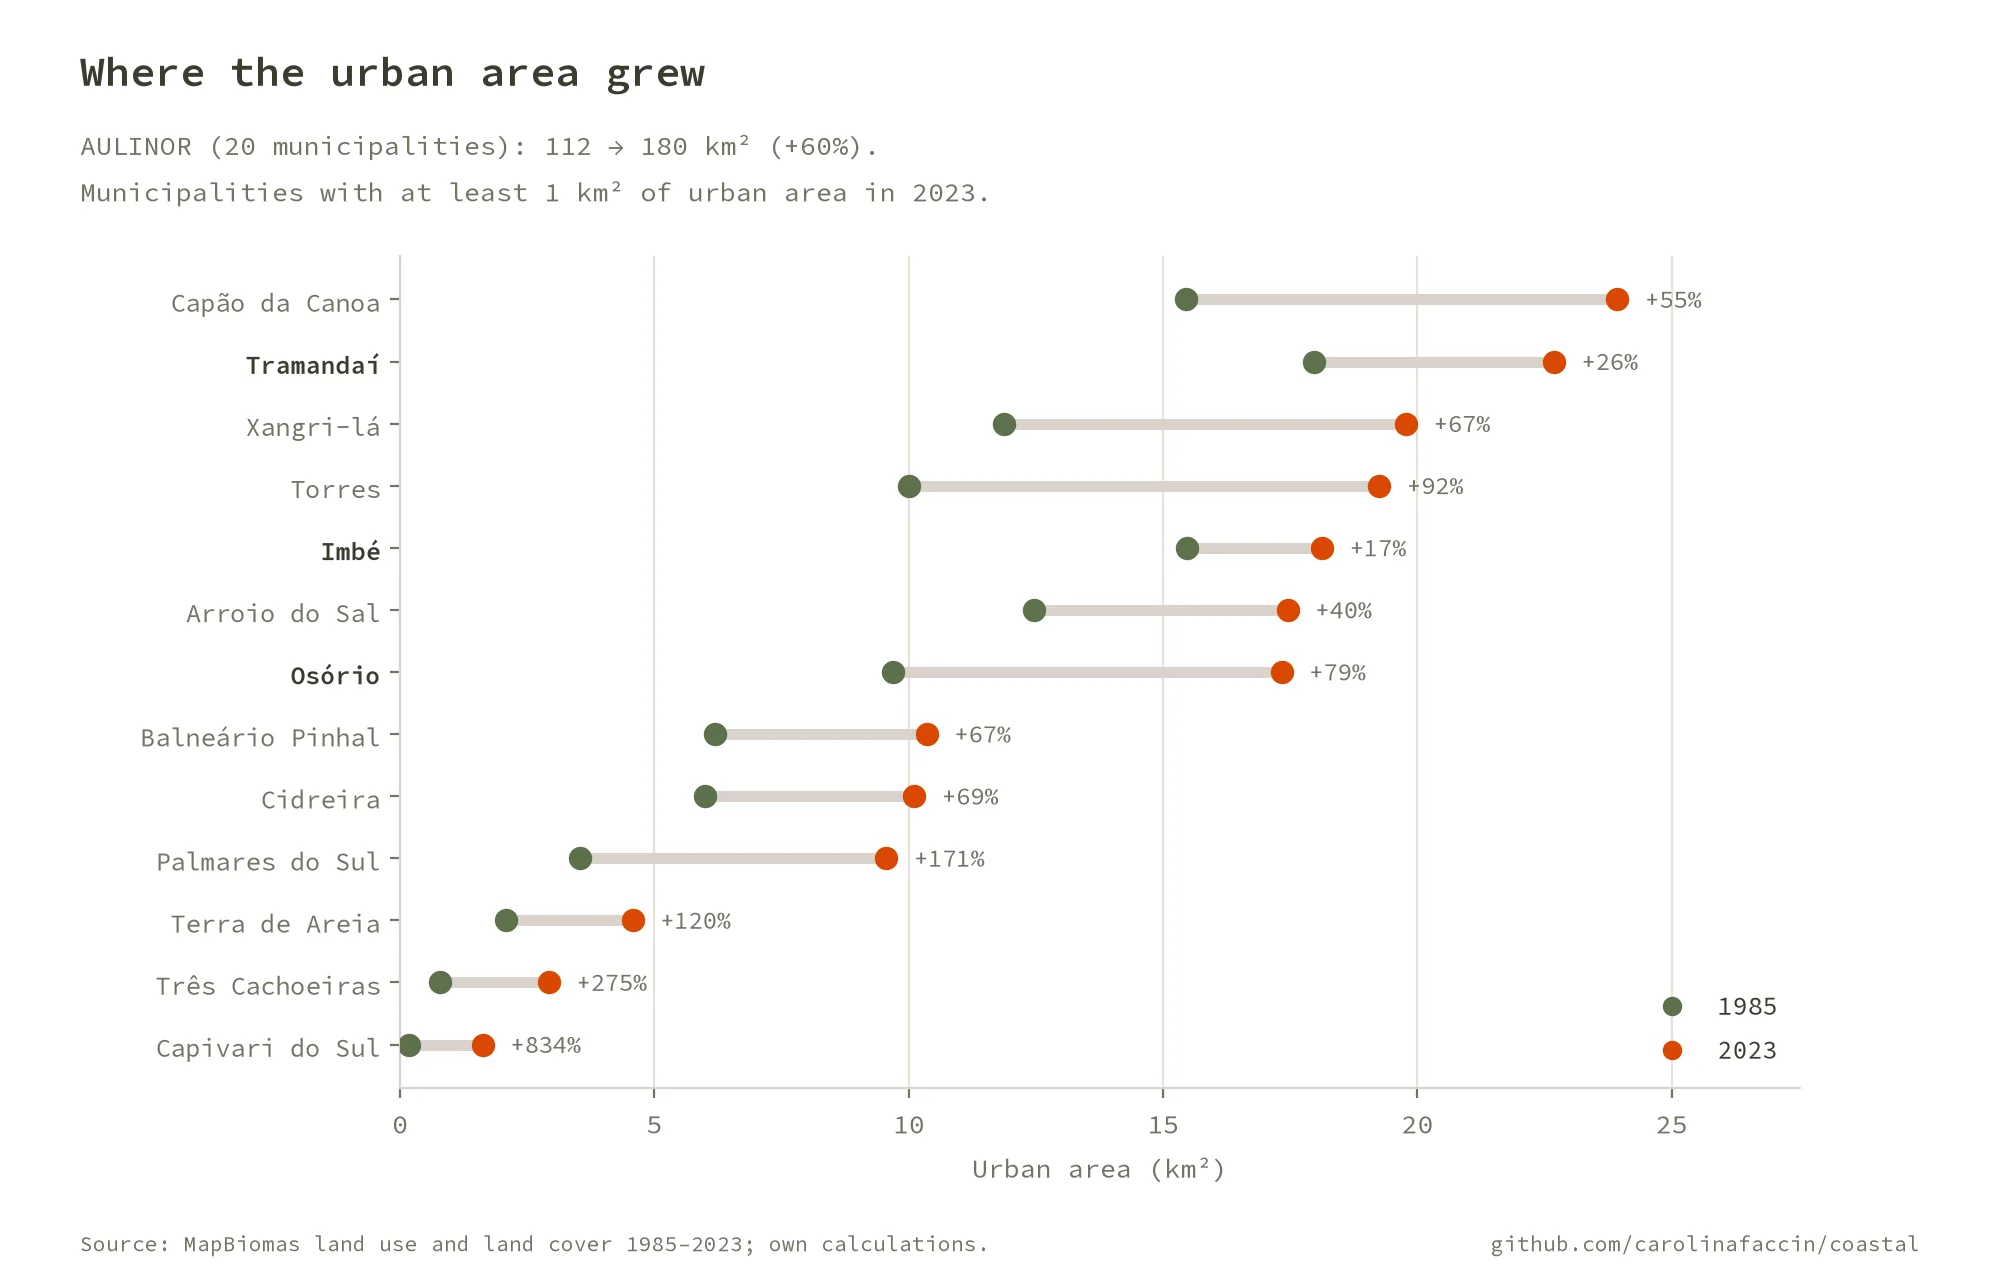
- The coastal urban agglomeration’s urbanized area grew by 60%, from 112 km² (1985) to 180 km² (2023).
- The region’s population grew 25.8% between 2010 and 2022; Imbé’s population multiplied 3.6 times between 1991 and 2022.
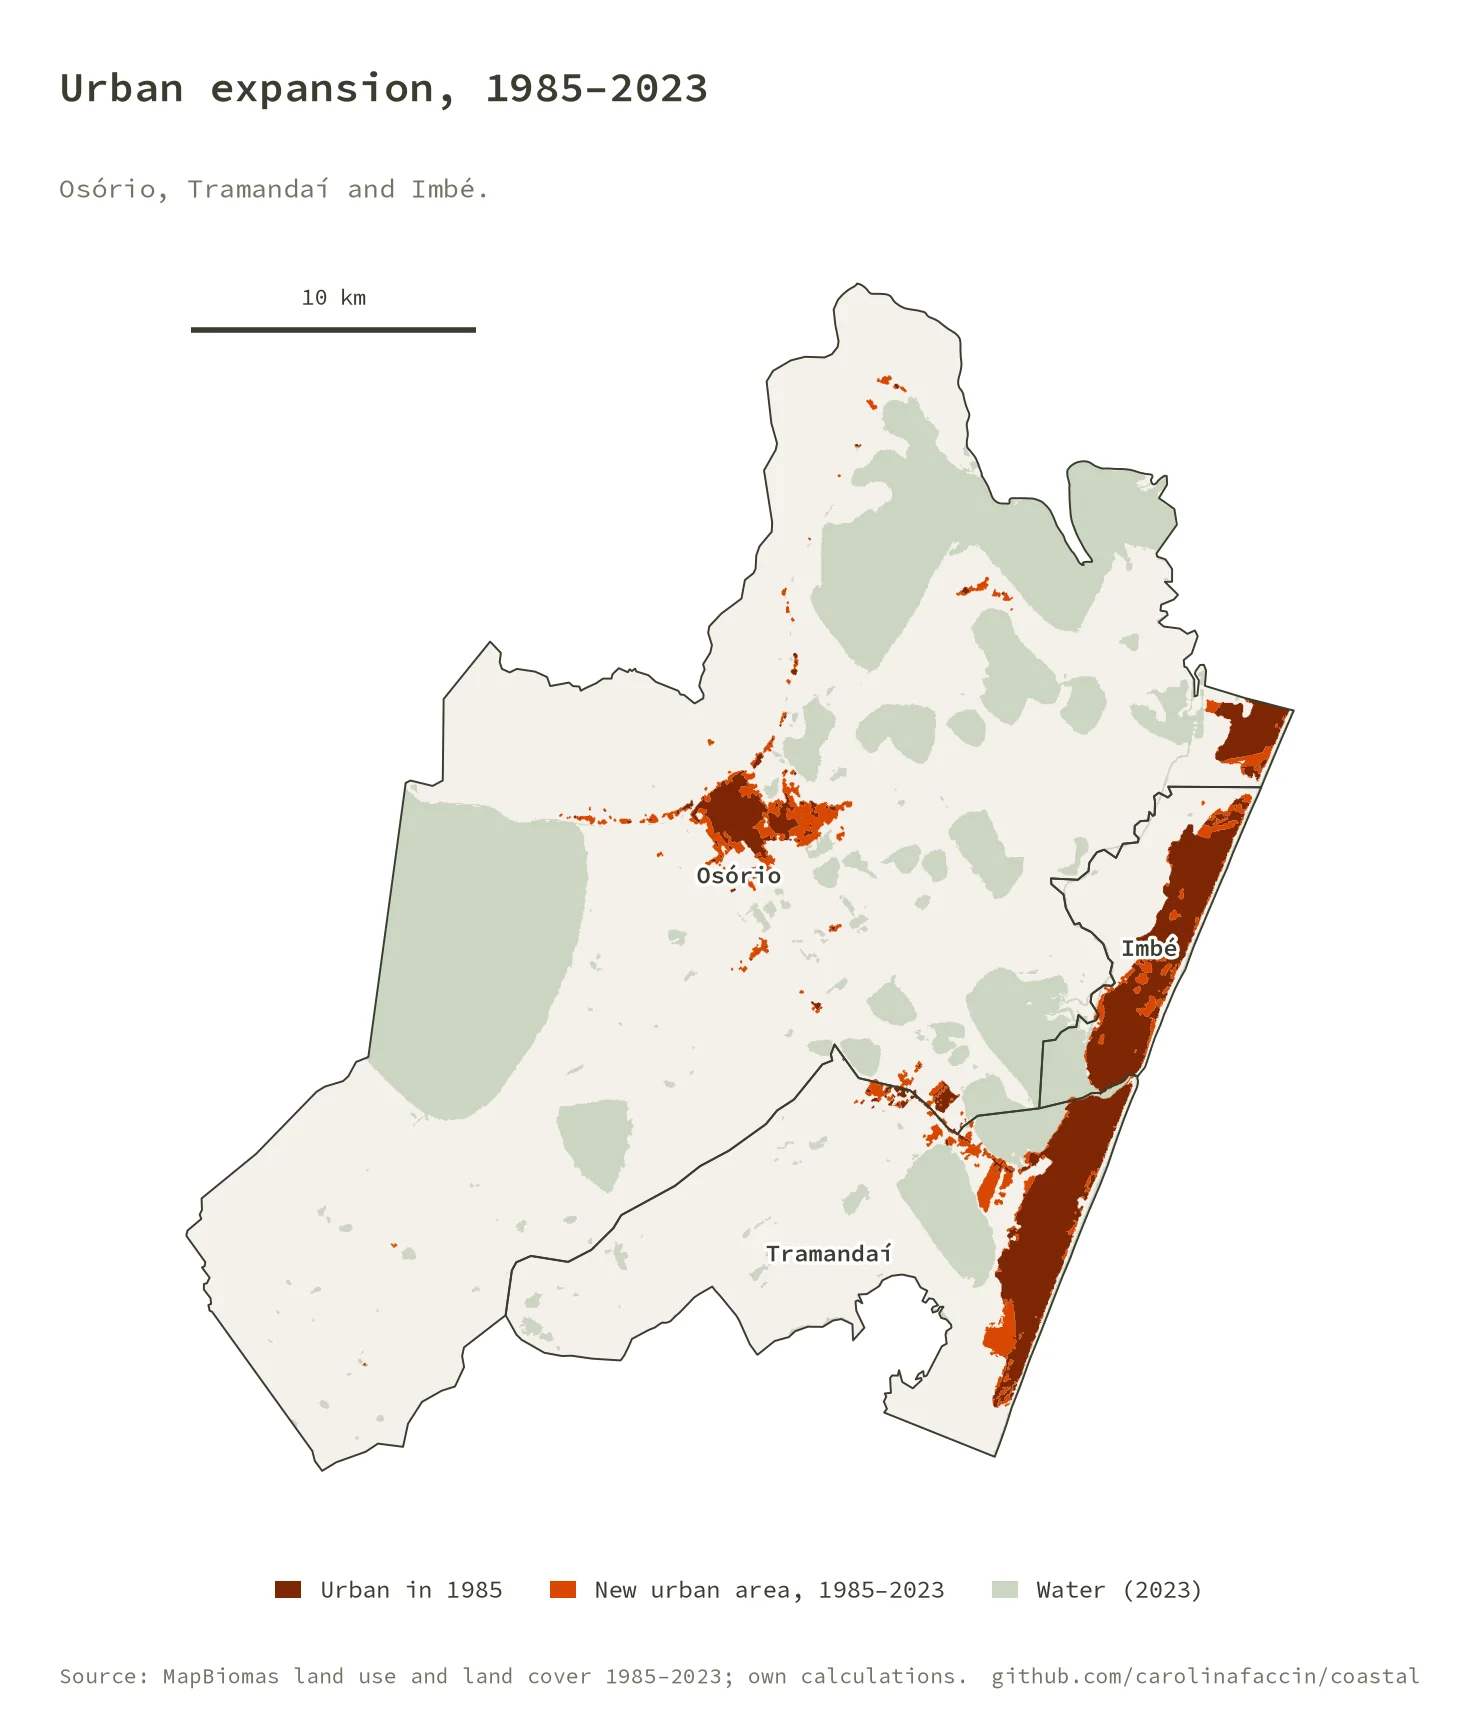
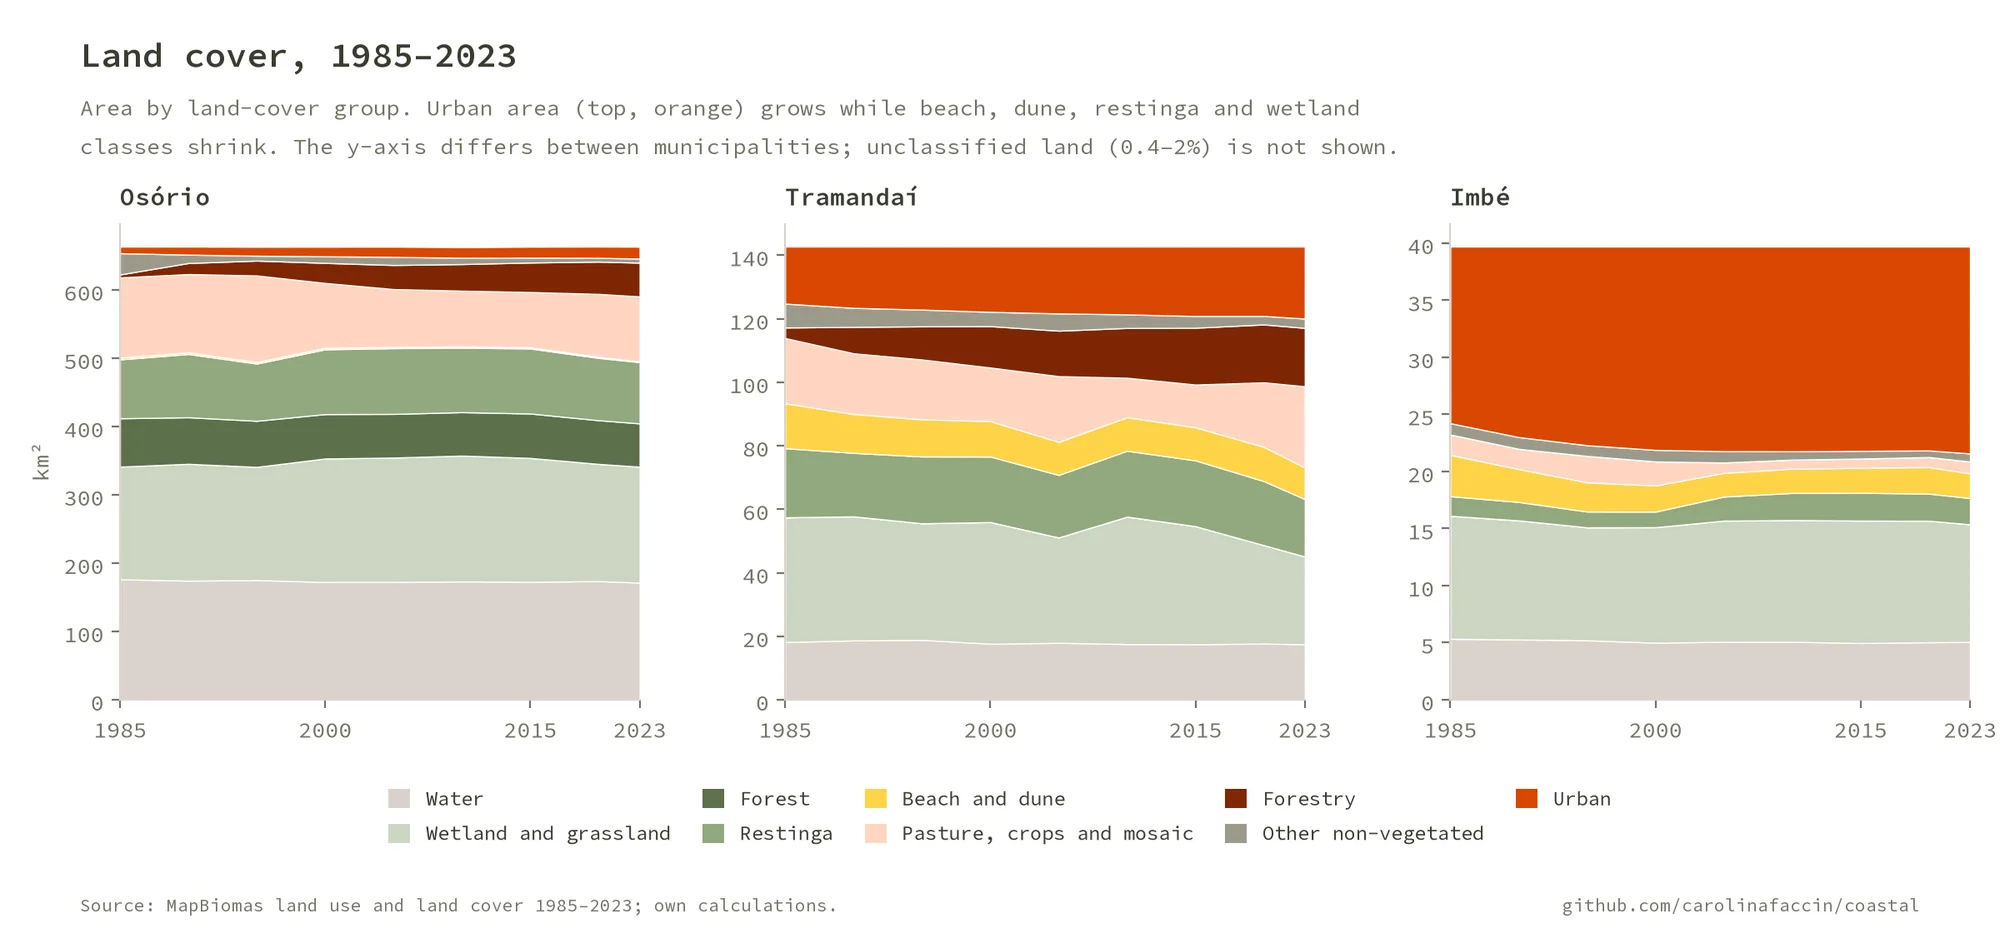
- Three distinct patterns: dispersed, fragmented sprawl in Osório (+79%); continuous growth and densification in Tramandaí (+26%); fast, seasonal growth in Imbé (+17%), encroaching on dunes and coastal vegetation (beach and dune cover fell by 40% in Imbé and 30% in Tramandaí).
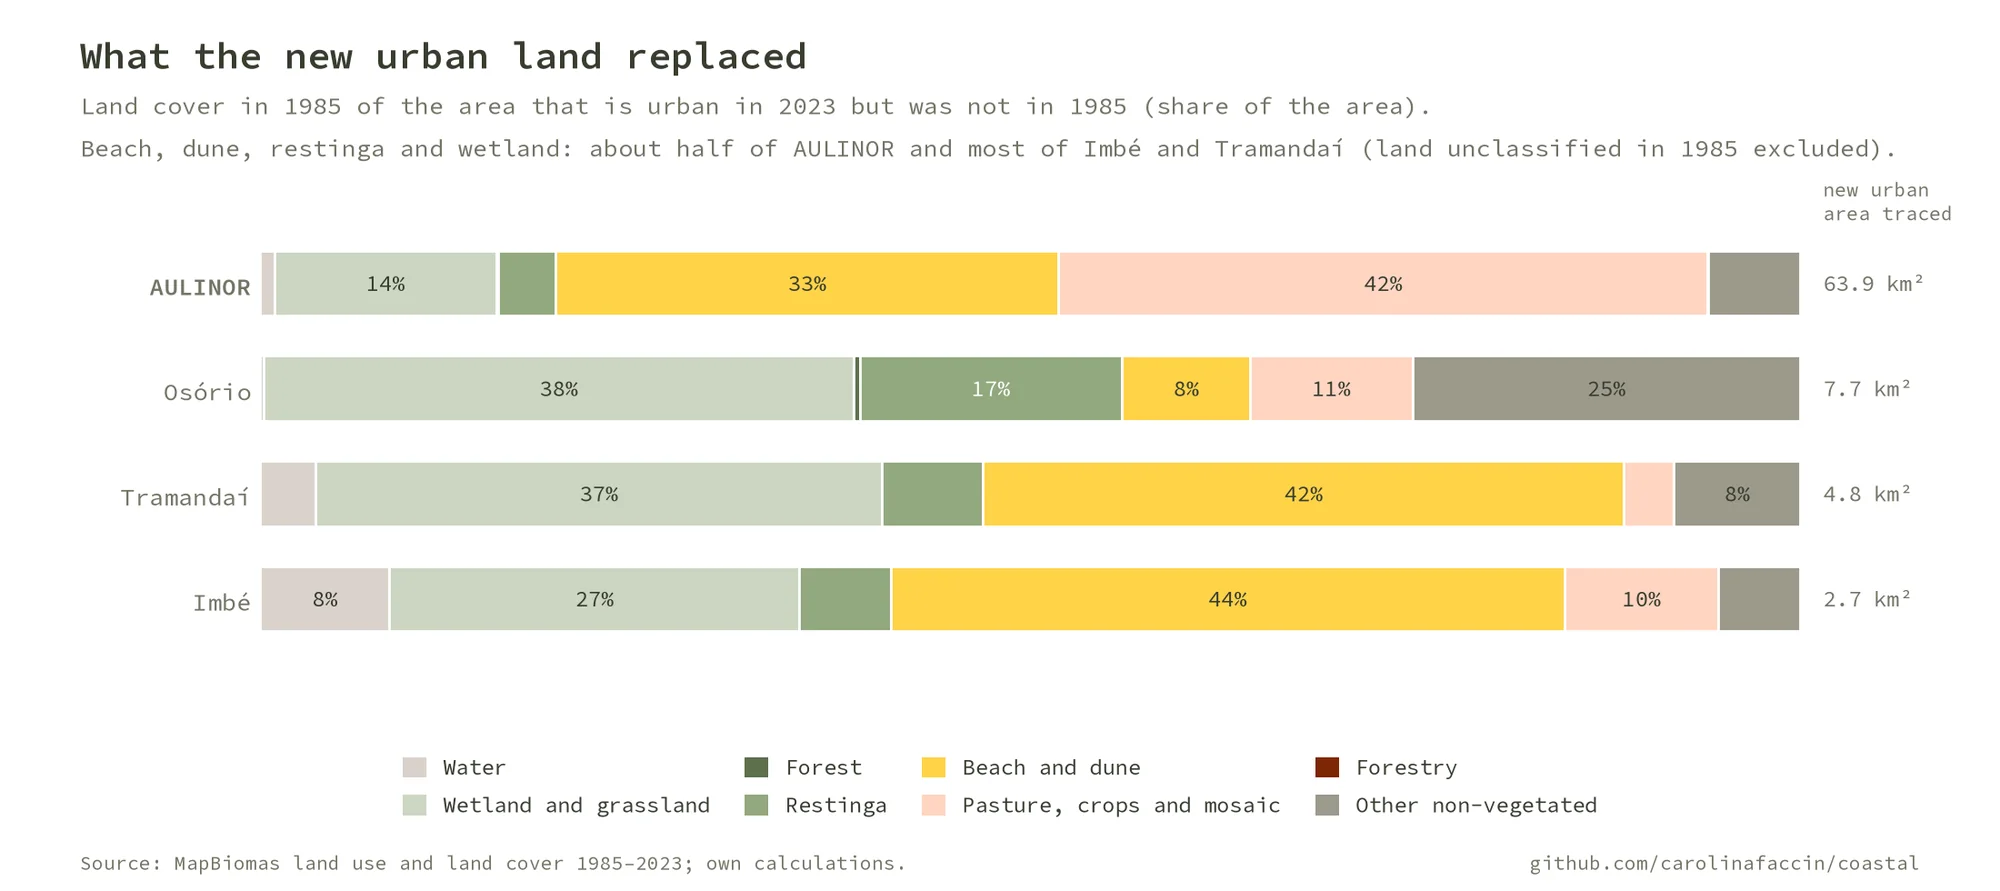
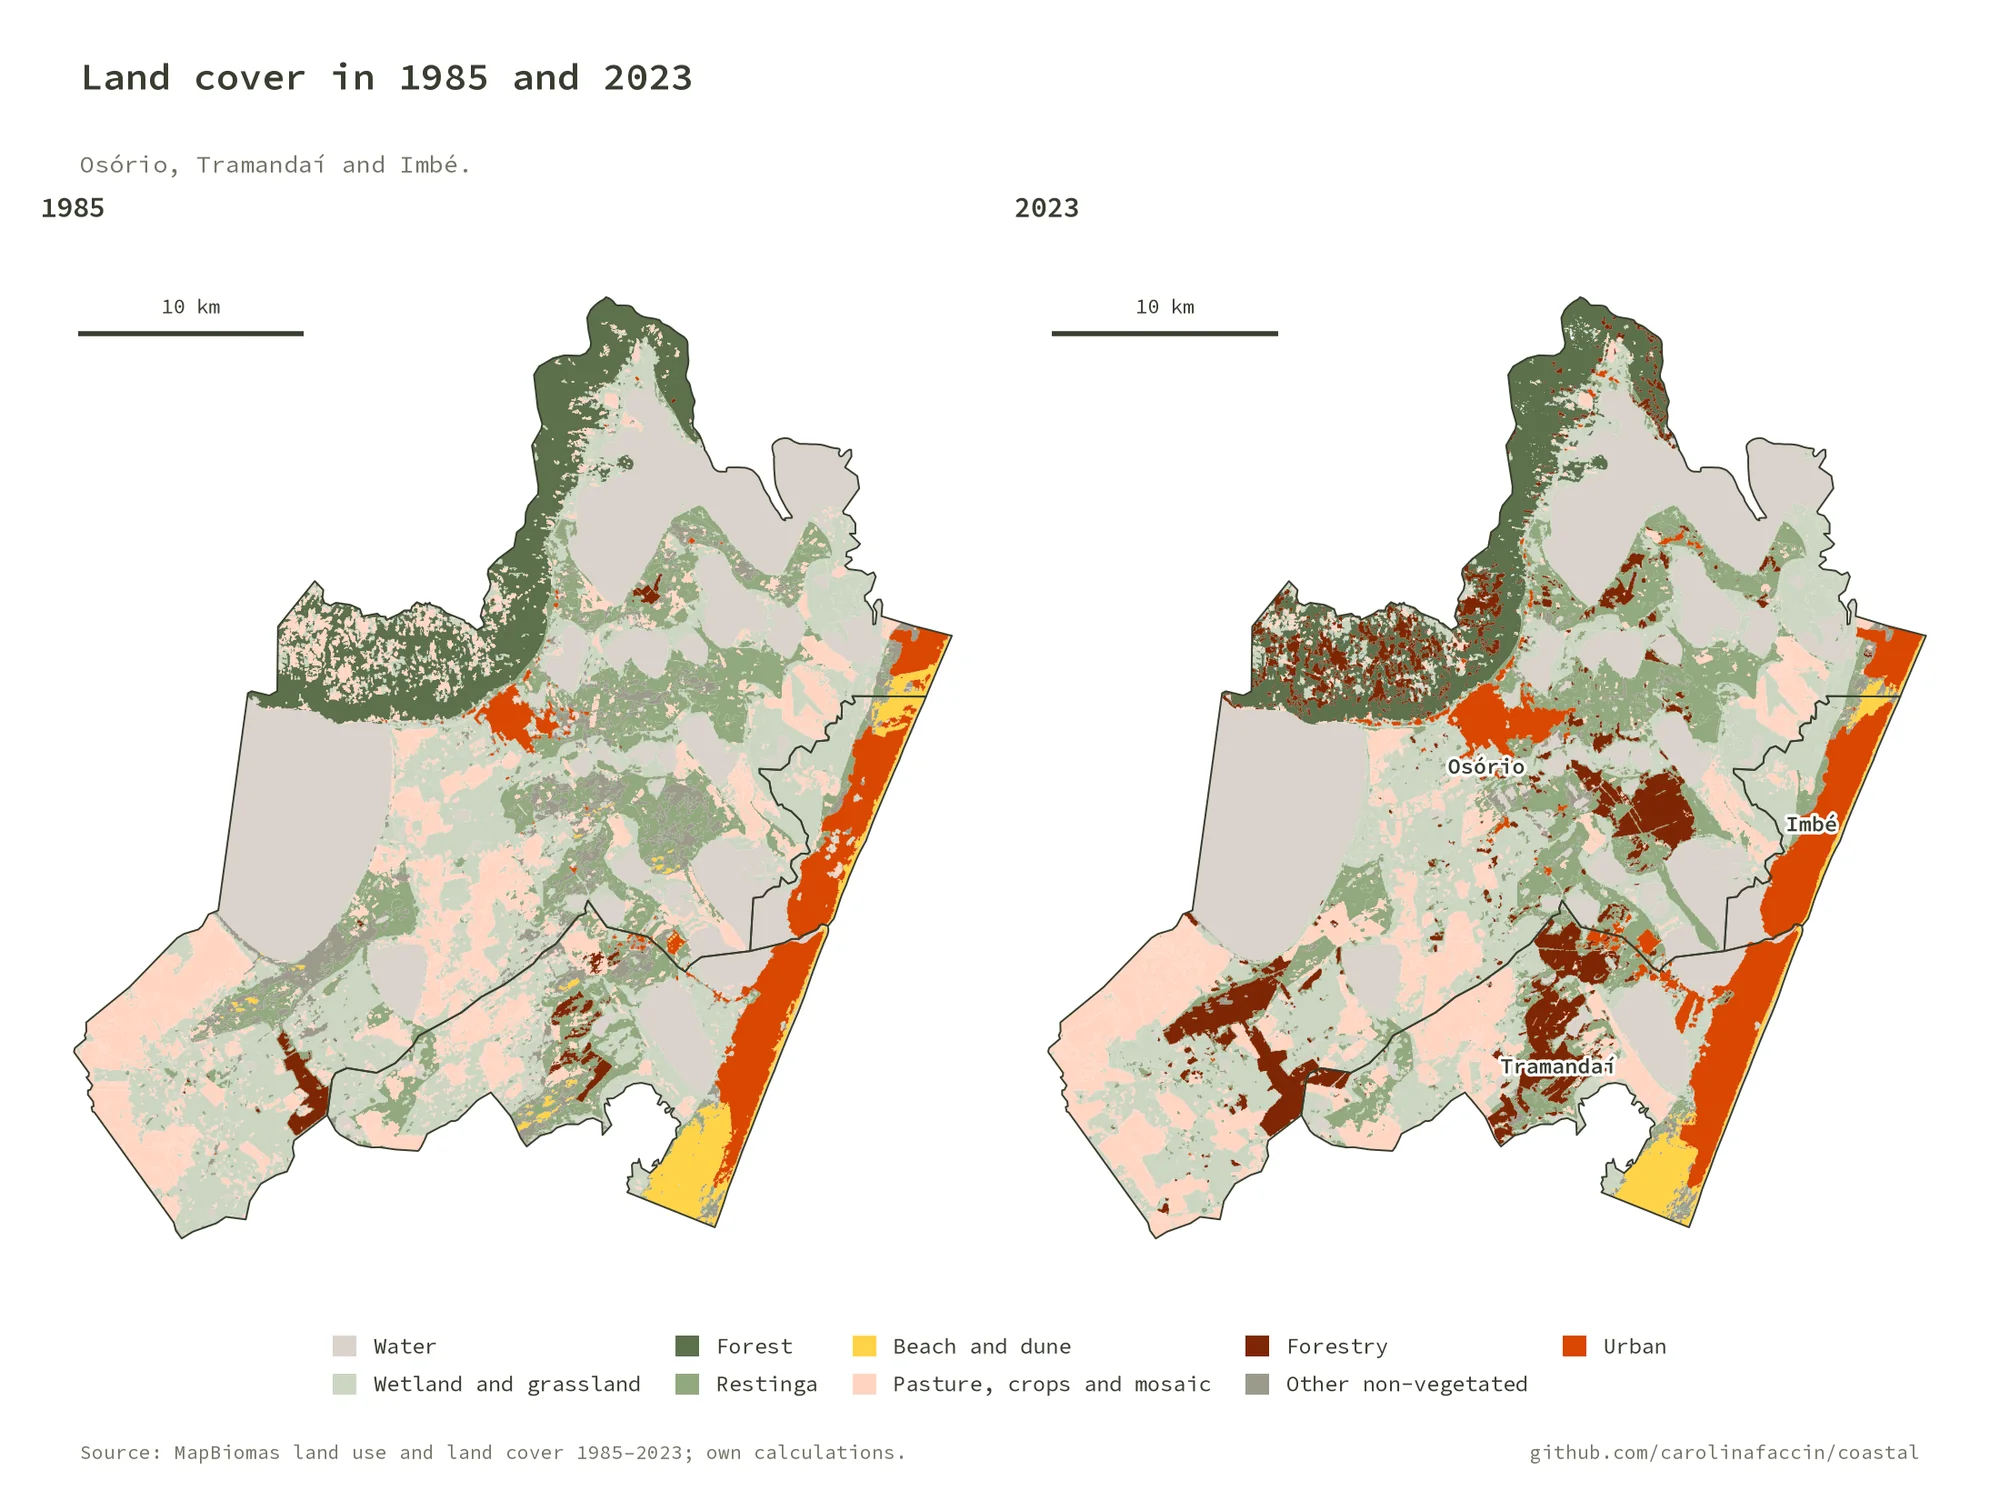
- Overlaying the 2023 urban area on the 1985 land cover shows what it replaced: 51% of the new urban land in AULINOR was beach, dune, restinga or wetland, rising to 85% in Tramandaí and 76% in Imbé.
Why it matters#
The results are a warning for coastal planning: urbanization is advancing over areas of high environmental sensitivity, and conurbation means one municipality’s choices affect its neighbors. The paper argues for integrated territorial and environmental management with regional solutions.
I later rebuilt the calculations as an open, reproducible Python pipeline that checks its results against the numbers published in the paper: code and data on GitHub.
Read the paper (PT): Faccin, Souza & Dalcin (2026), Patterns of urban transformation and land use and land cover on the North Coast: Osório, Tramandaí and Imbé.
Figures#
Produced by the open pipeline above.